Not too long ago, a company in the agriculture machinery sector started receiving a bunch of unexpected service calls. Following the launch of a new variation of one of their machines, some of the units from the first production lots were experiencing early failures. In particular, these were coming from a control valve failing well earlier than expected; a component that wasn't supposed to fail during the estimated lifetime of the machine.
In response to this issue, besides replacing the failed components on the field, and engineering a new design that substituted the faulty component for a bigger, sturdier one, this company decided to get a proper grasp of the situation and obtain a data-driven understanding of the implications they were going to face up until the new revision was up and running. At that point, they decided to contact Broadstat, which led to them being able to start inputting data and obtaining actionable results on the very same day. They were so happy with the results, that they agreed to share the success story in the form of a case study to help other people.
Here is a walkthrough, step by step, of how they used Broadstat to make the most out of their data to regain control of their situation.
Starting a new project
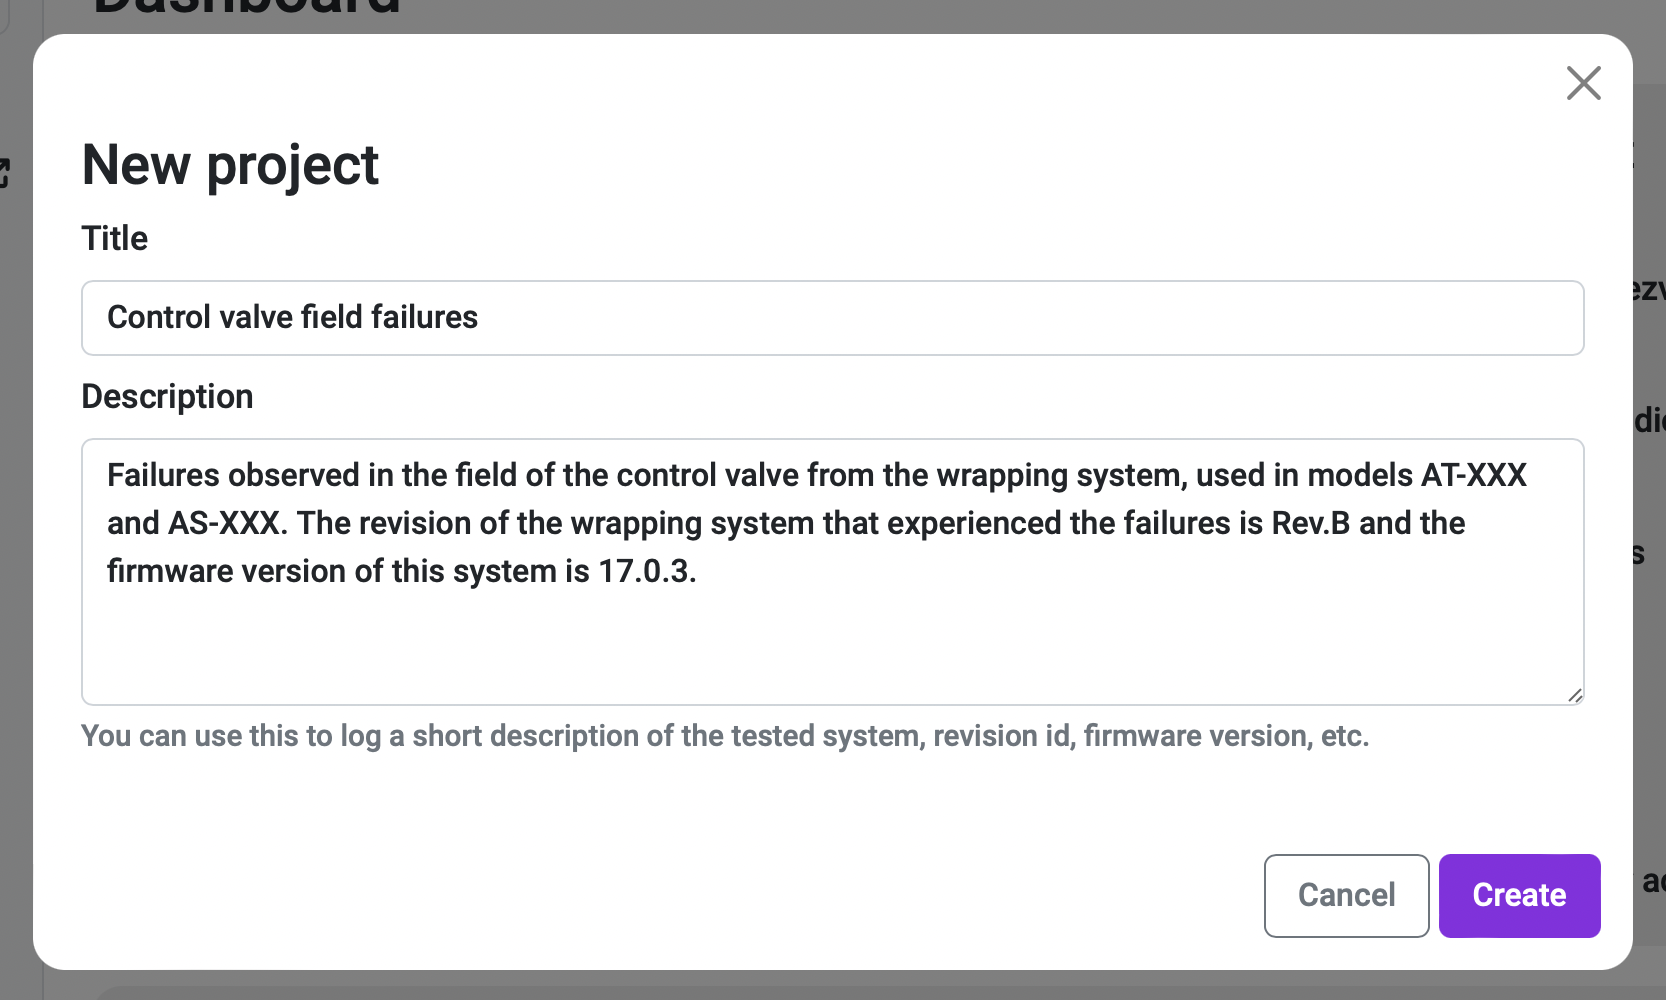
When clicking the "New project" button, a prompt asks us to choose a project name and give it a description. For the name, we select something that is easily recognizable, like "Control Valve Field Failures", with the intent of not mistaking it for other valve studies we potentially make down the line. As for the description, we at Broadstat suggest not only giving a quick hint of what the project is about but also stating the status of variables that could have an impact on the study and that may need to be known for potential replications in an experiment. You can see in the following picture a made-up example we created for this case study.
After creating the project, we are taken to the Project planning section. Here, one of the key parameters to fill in is the Failure definition one, as it keeps consistency throughout the test and with everyone involved in the study. If, like in this case, we are sure that all the failure modes are exactly the same for all the occurrences that have been reported for causing a system breakdown, we can skip this part (although it's always recommended to complete it to limit detection subjectivity in the tests).
Introducing the data
When we are done introducing all the description information about our project, we can move on to the Data input section. In this case, we are going to introduce the real-life data collected by our friends at the agriculture machinery company. Here's the table of the data, consisting of 17 failures:
| Machine ID | Number of cycles | Failure/ Suspension |
|---|---|---|
| AT-400-0432 | 14605 | F |
| AT-400-0457 | 14607 | F |
| AT-400-0459 | 20383 | F |
| AT-400-0425 | 15426 | F |
| AT-400-0462 | 15377 | F |
| AT-400-0434 | 17679 | F |
| AT-400-0488 | 14050 | F |
| AT-400-0435 | 14206 | F |
| AT-400-0440 | 16020 | F |
| AT-400-0437 | 14539 | F |
| AT-400-0473 | 16493 | F |
| AS-400-0221 | 17931 | F |
| AS-400-0224 | 16871 | F |
| AS-400-0232 | 10640 | F |
| AS-400-0230 | 14726 | F |
| AS-400-0225 | 16883 | F |
| AS-400-0229 | 15843 | F |
It was possible to capture this data because the machines have a cycle logging registry in their integrated main processor, and the loss of pressure that revealed the failure of the system could be pinpointed to an exact moment. For that reason, the failure detection in this case is associated with a specific cycle count, instead of an interval of detection (as it is when one is unsure of when exactly the failure happened but knows the span of time in which it did). So the "Last checked" switch is untoggled, and the inputting of exact failure data in our Broadstat project looks like this:
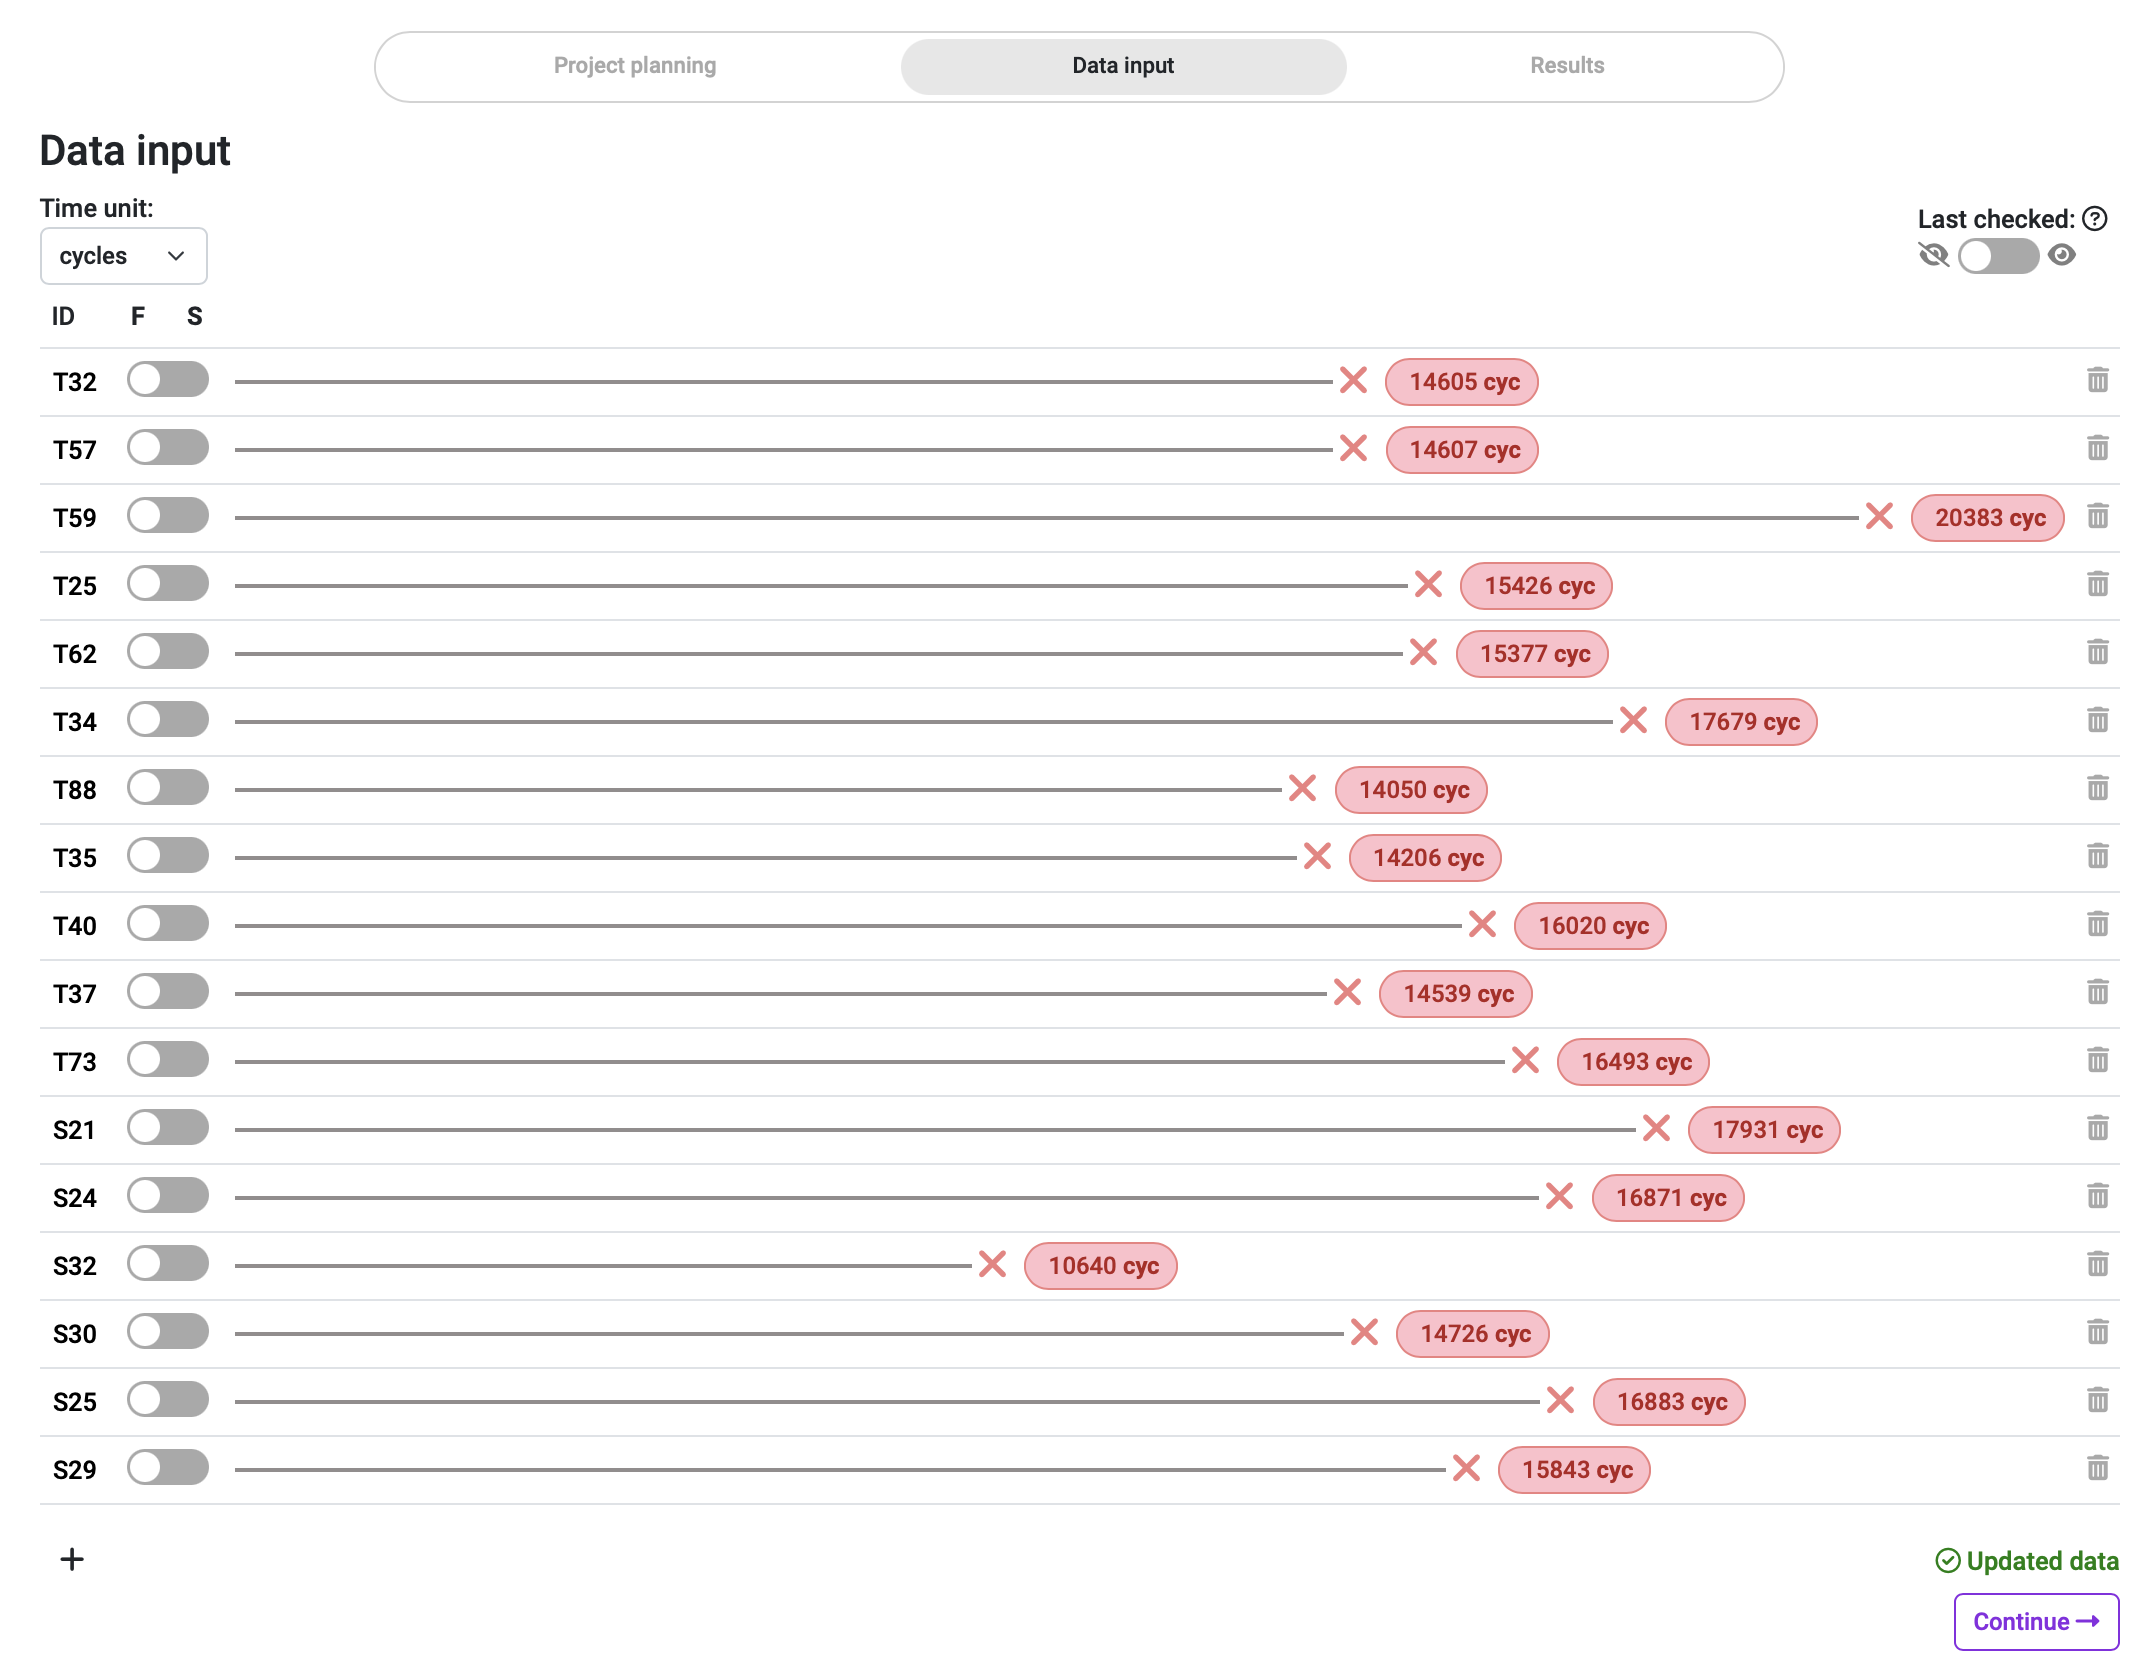
In this case, to make it easy for us to identify every single sample of our study, we've used their ID number but simplified to reduce it to three characters, as in AT-400-0432 for the first sample. All of them are specified as failures (F in the F/S switch), as no suspensions have been included in our dataset. When we continue to the Results section, we observe automatically the first bits of actionable data.
Obtaining our results
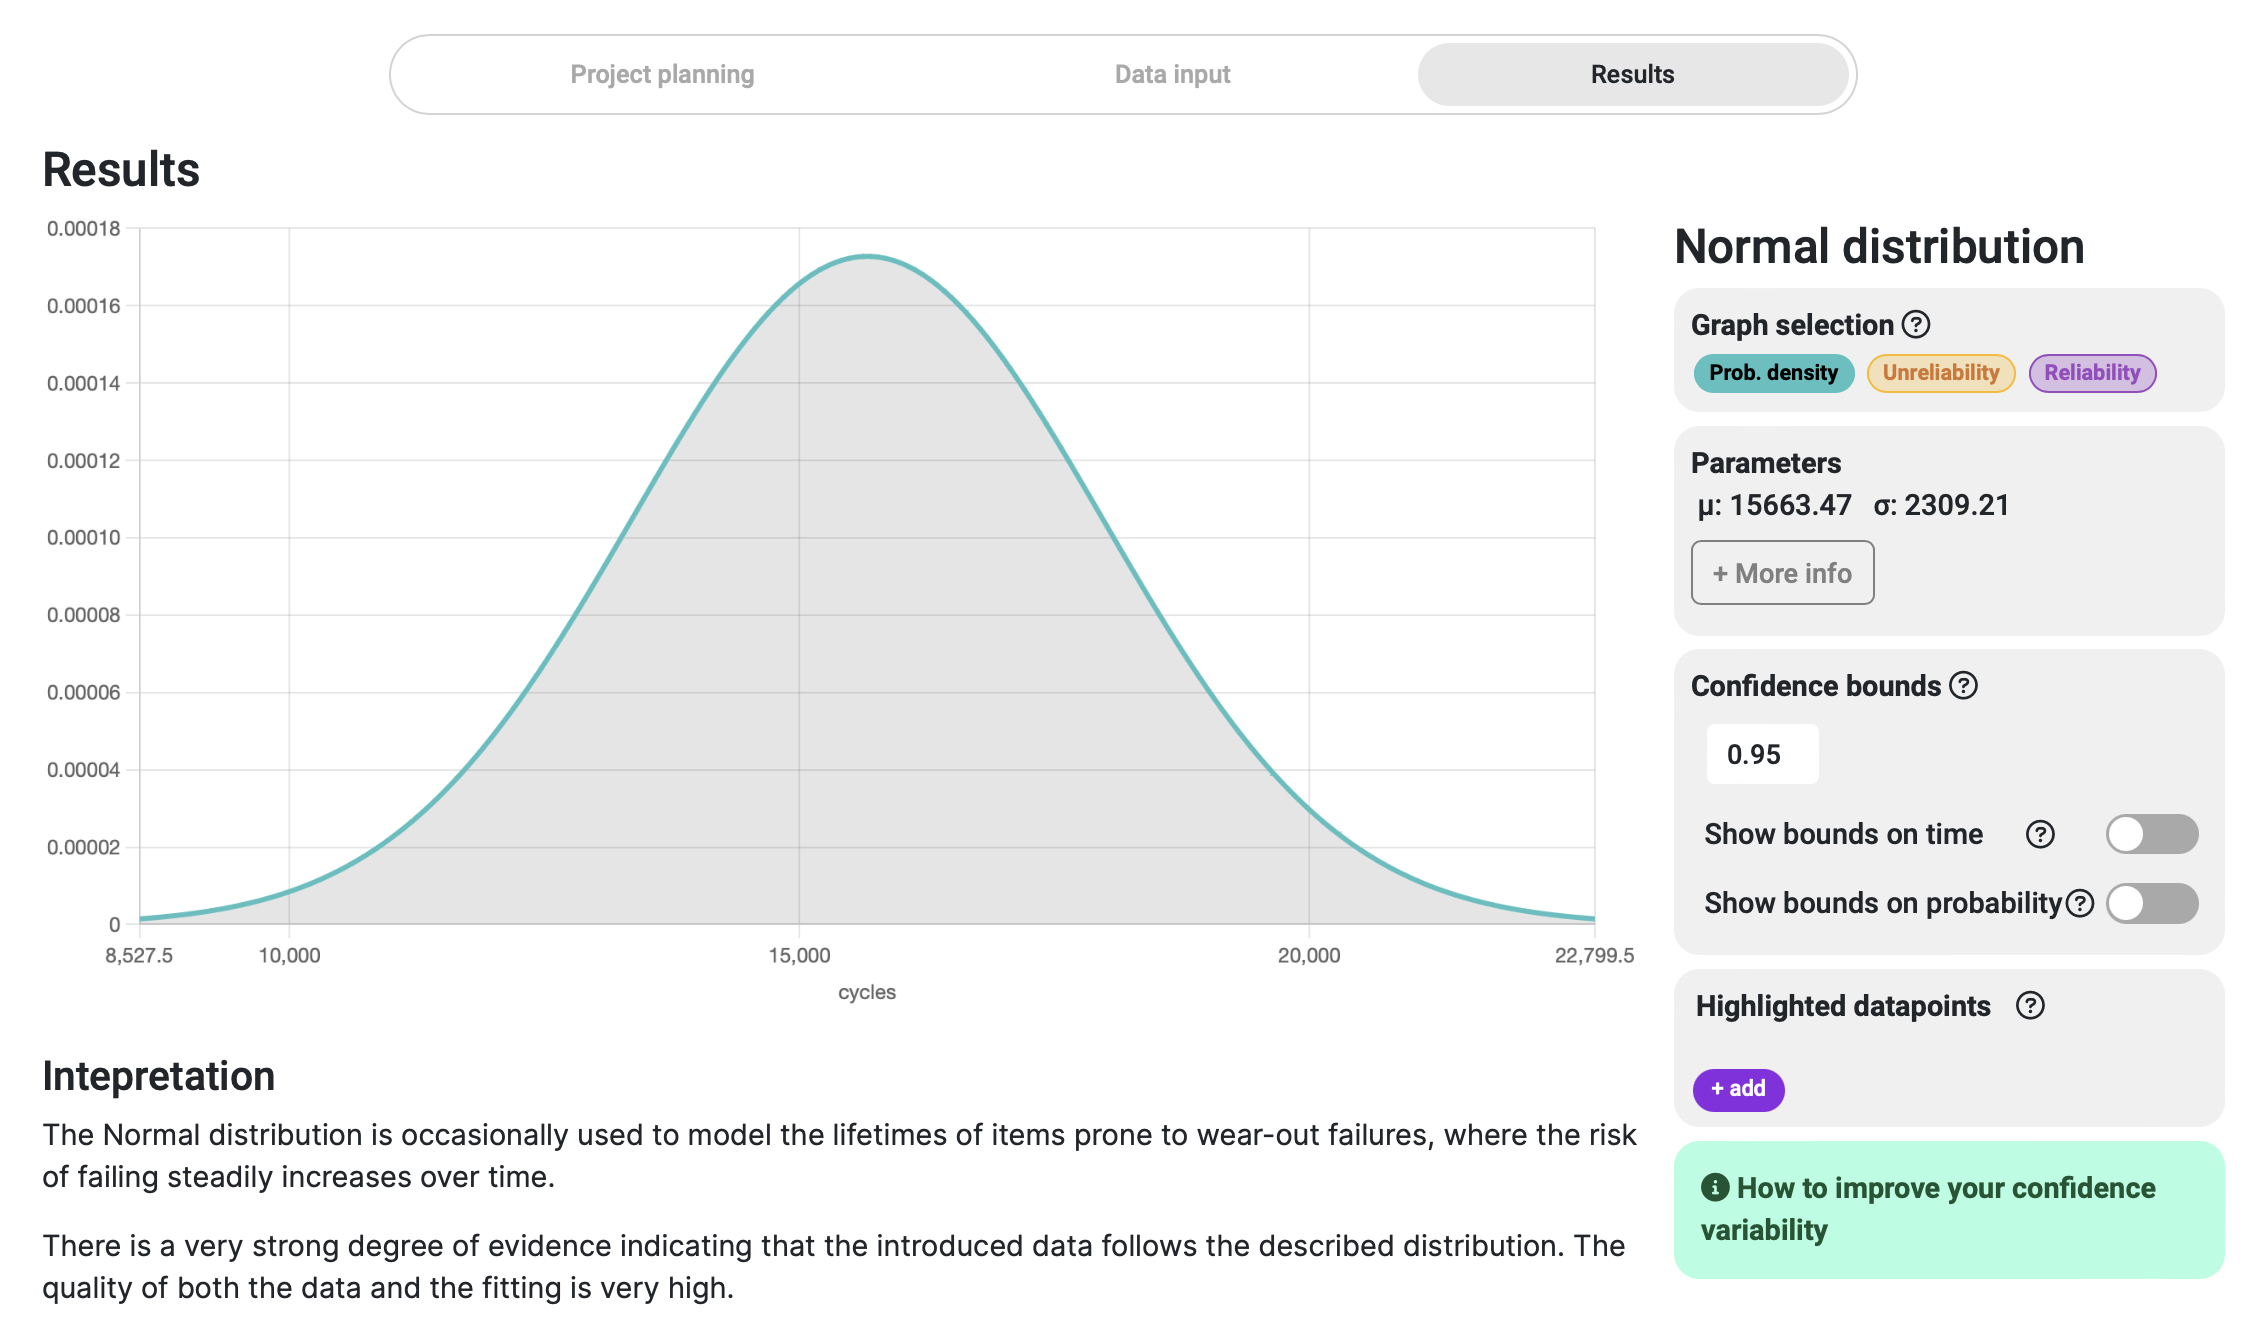
The first things we notice from the displayed results are that our dataset is best fitted in a Normal distribution with a peak of failure probability around 15,600 cycles. We are also told that the correlation is very strong, meaning that our data has a high degree of resemblance to the mentioned distribution, and the results obtained can be trusted to be representative of our system.
If we change our view to the Unreliability curve, up in the Graph selection area, and select to show the confidence bounds, we can observe the accumulated probability of failure over time and the span in which we can "ensure" the values will be, given the selected confidence bounds.
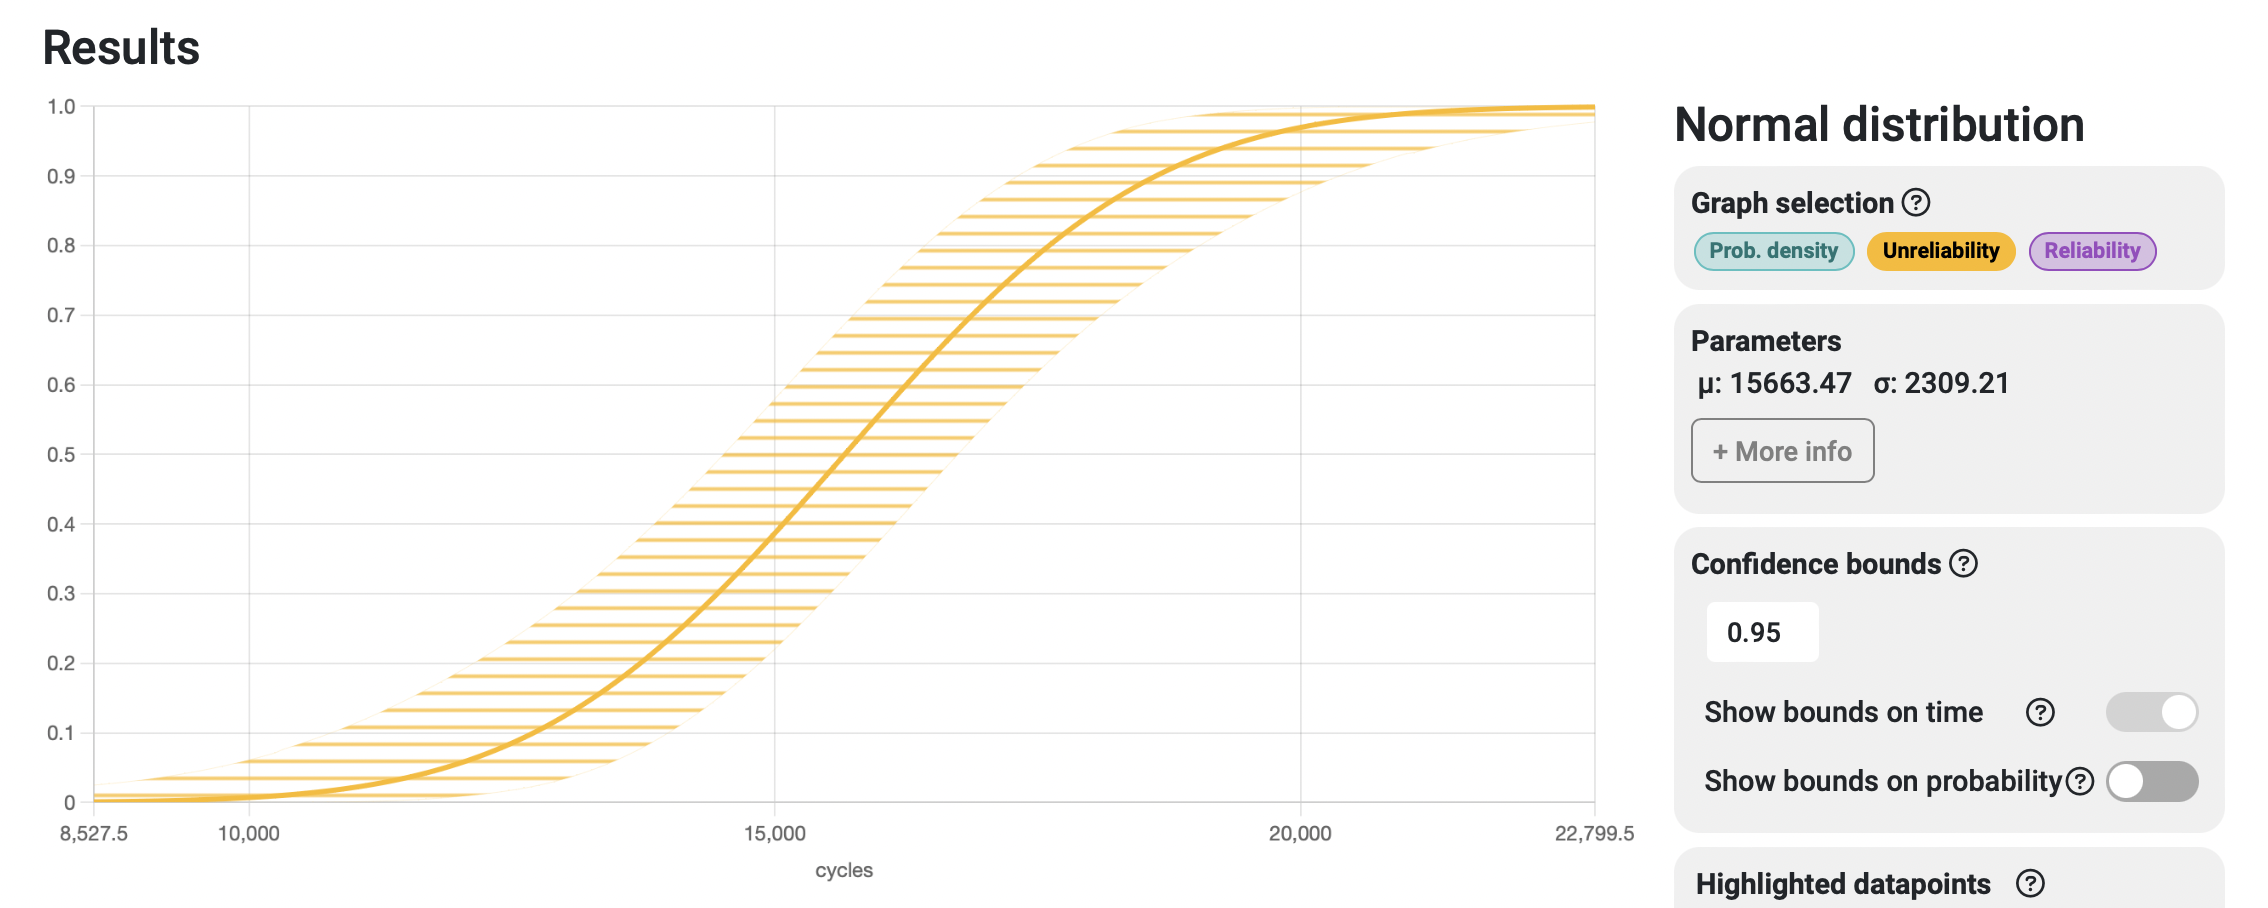
We choose to leave the conficence bounds value at 95% (or 0.95), as it's an industry standard, but one can observe the changes in width of this "confidene band" when the parameter is modified. It can also be observed in the Reliability graph, which is actually just the inverse curve of this one — each of them displaying the overall probability of survival over time and the overall probability of failure over time, respectively.
Selecting specific outputs of interest
Up to this point, we have successfully characterized the statistical failure behavior of our system, and we have interactive graphs to explore and obtain interesting data. However, it can be a bit overwhelming to have all these probability curves and try to translate them into the day-to-day actionable results that your project needs. That is why we use the Highlighted datapoints that help us scrutinize specific curve points and display them in human-readable text.
By clicking on the Add button in the Highlighted Datapoints area, you are presented with a prompt of options that can be queried from your result curve. For example, the first information we want to obtain is the estimated time at which the chances of failure of a system reach 15%.
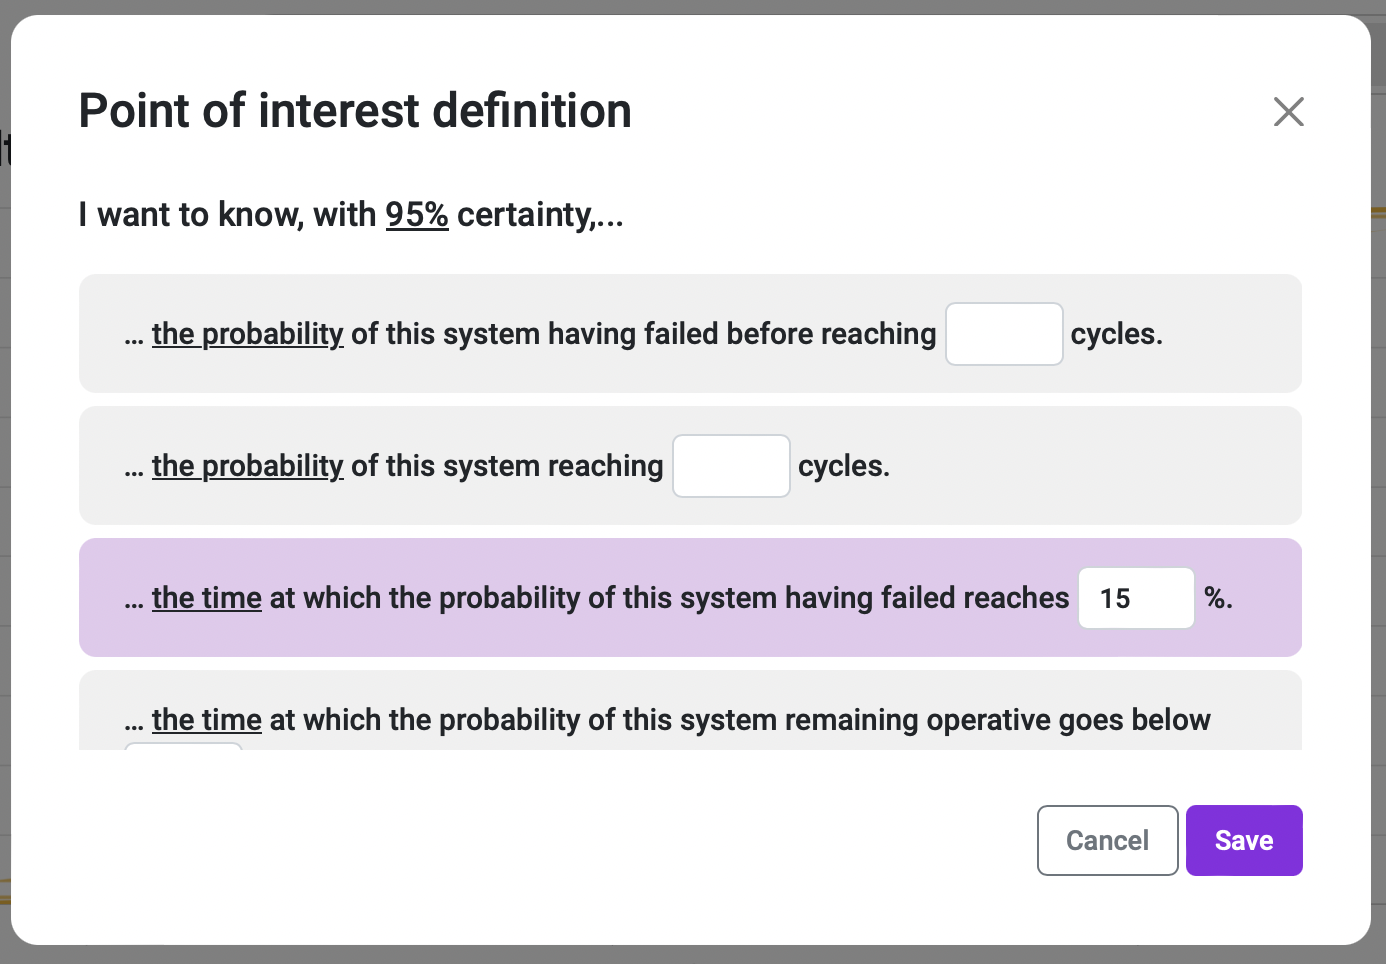
At the top of this prompt, we can see that the certainty level of these responses is 95% in this specific case, which is the value we set for the Confidence bounds. If the Confidence bounds value is changed afterward, the result of the highlighted datapoints gets updated automatically.
Once we click the Save button, we can instantly see the highlighted point in the corresponding graph, the Highlights section, and in the human-readable interpreted results:
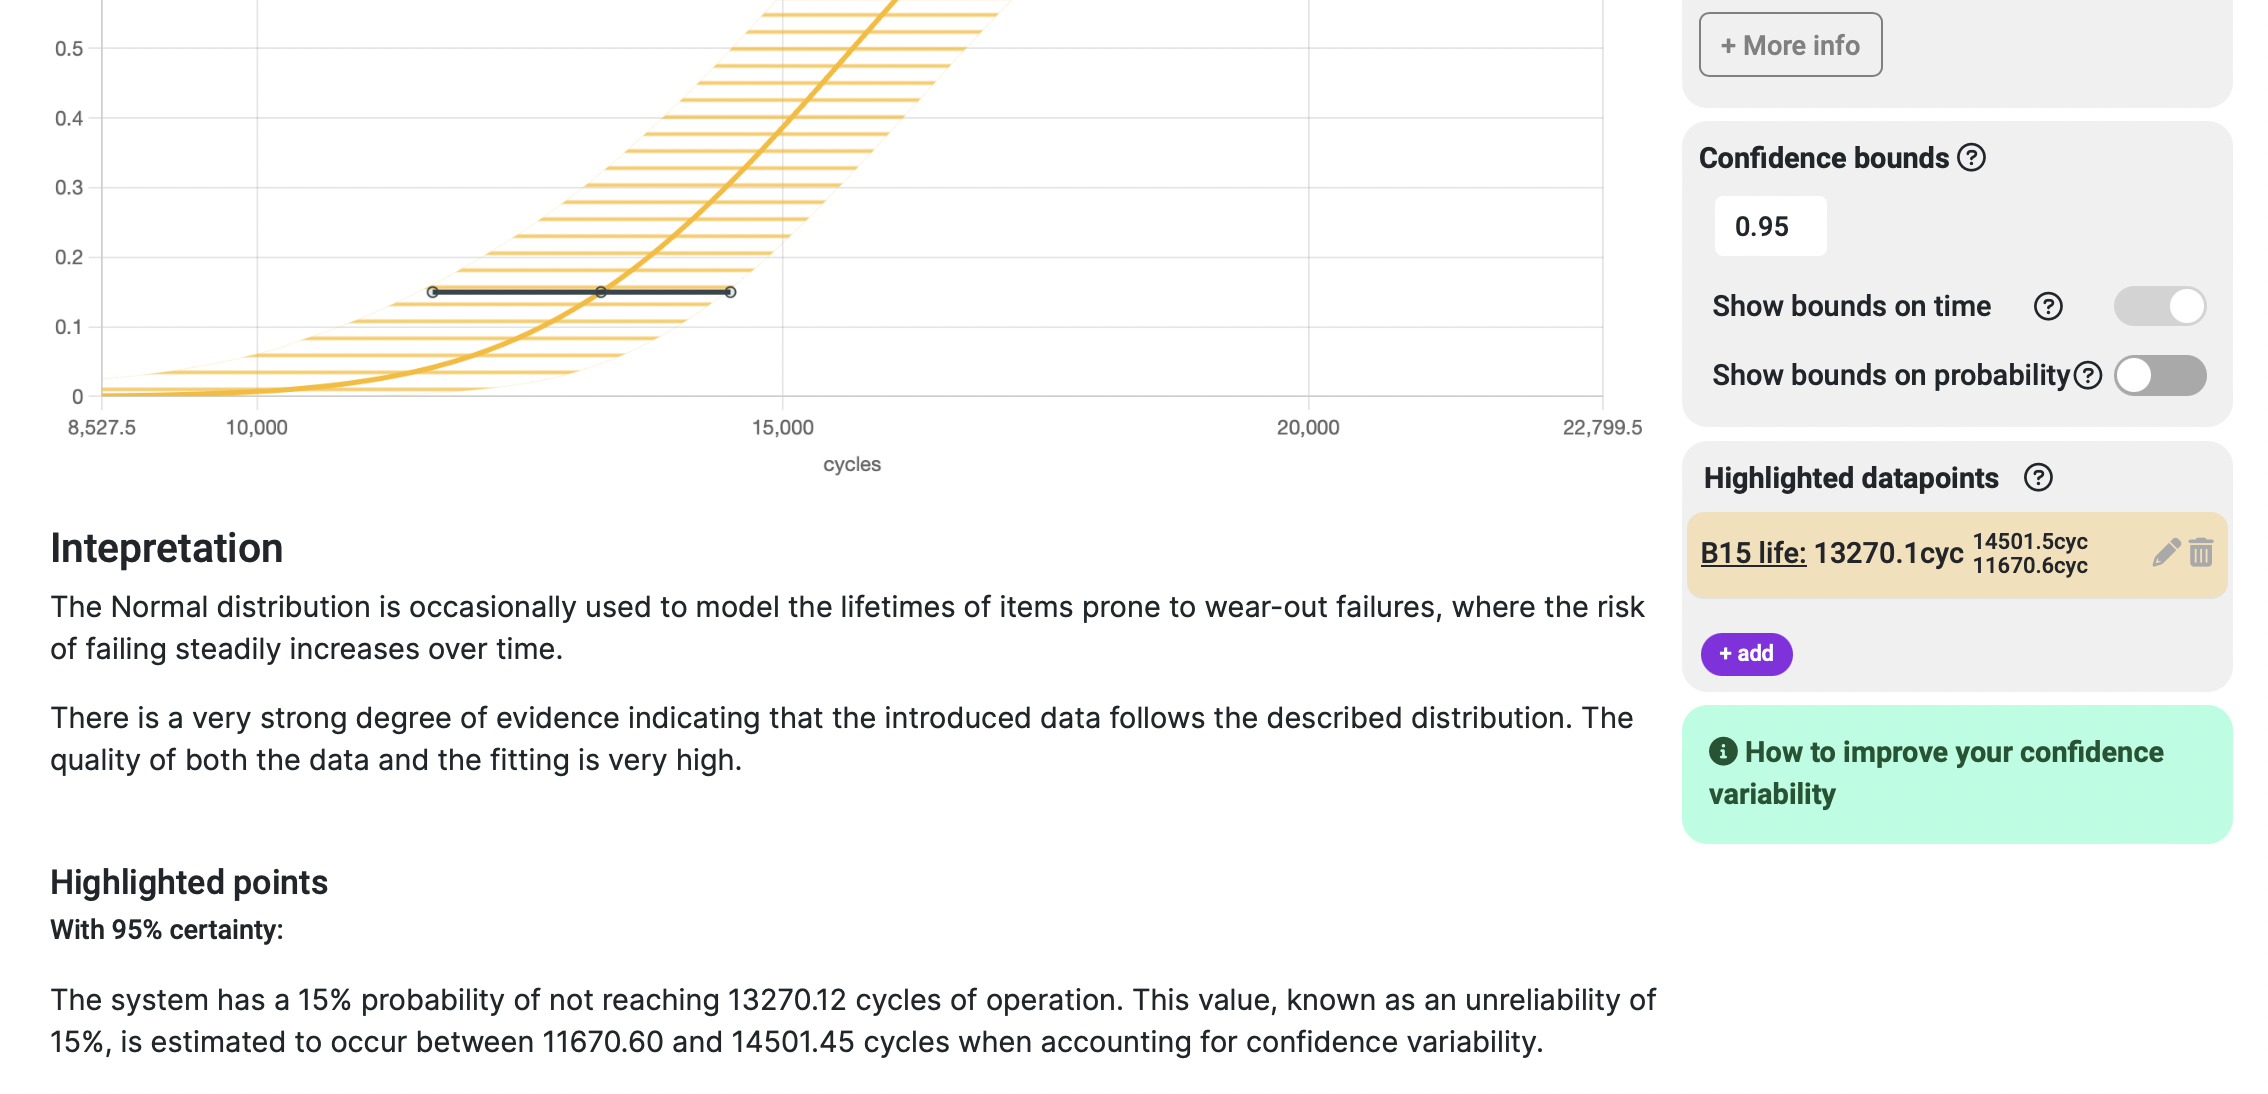
So now we know that, with 95% certainty, and in a conservative scenario, the 15% probability of failure will be reached at 11,670 cycles of operation. Here, we requested a value of time (in this instance, the number of cycles) for a fixed probability (i.e., 15% failure probability).
If we add another point asking for the probability of failure given a fixed number of cycles, we observe that the variability of the results is vertical along the axis of the evaluated parameter. This specific point requests the percentage of systems that will fail by a certain number of cycles:
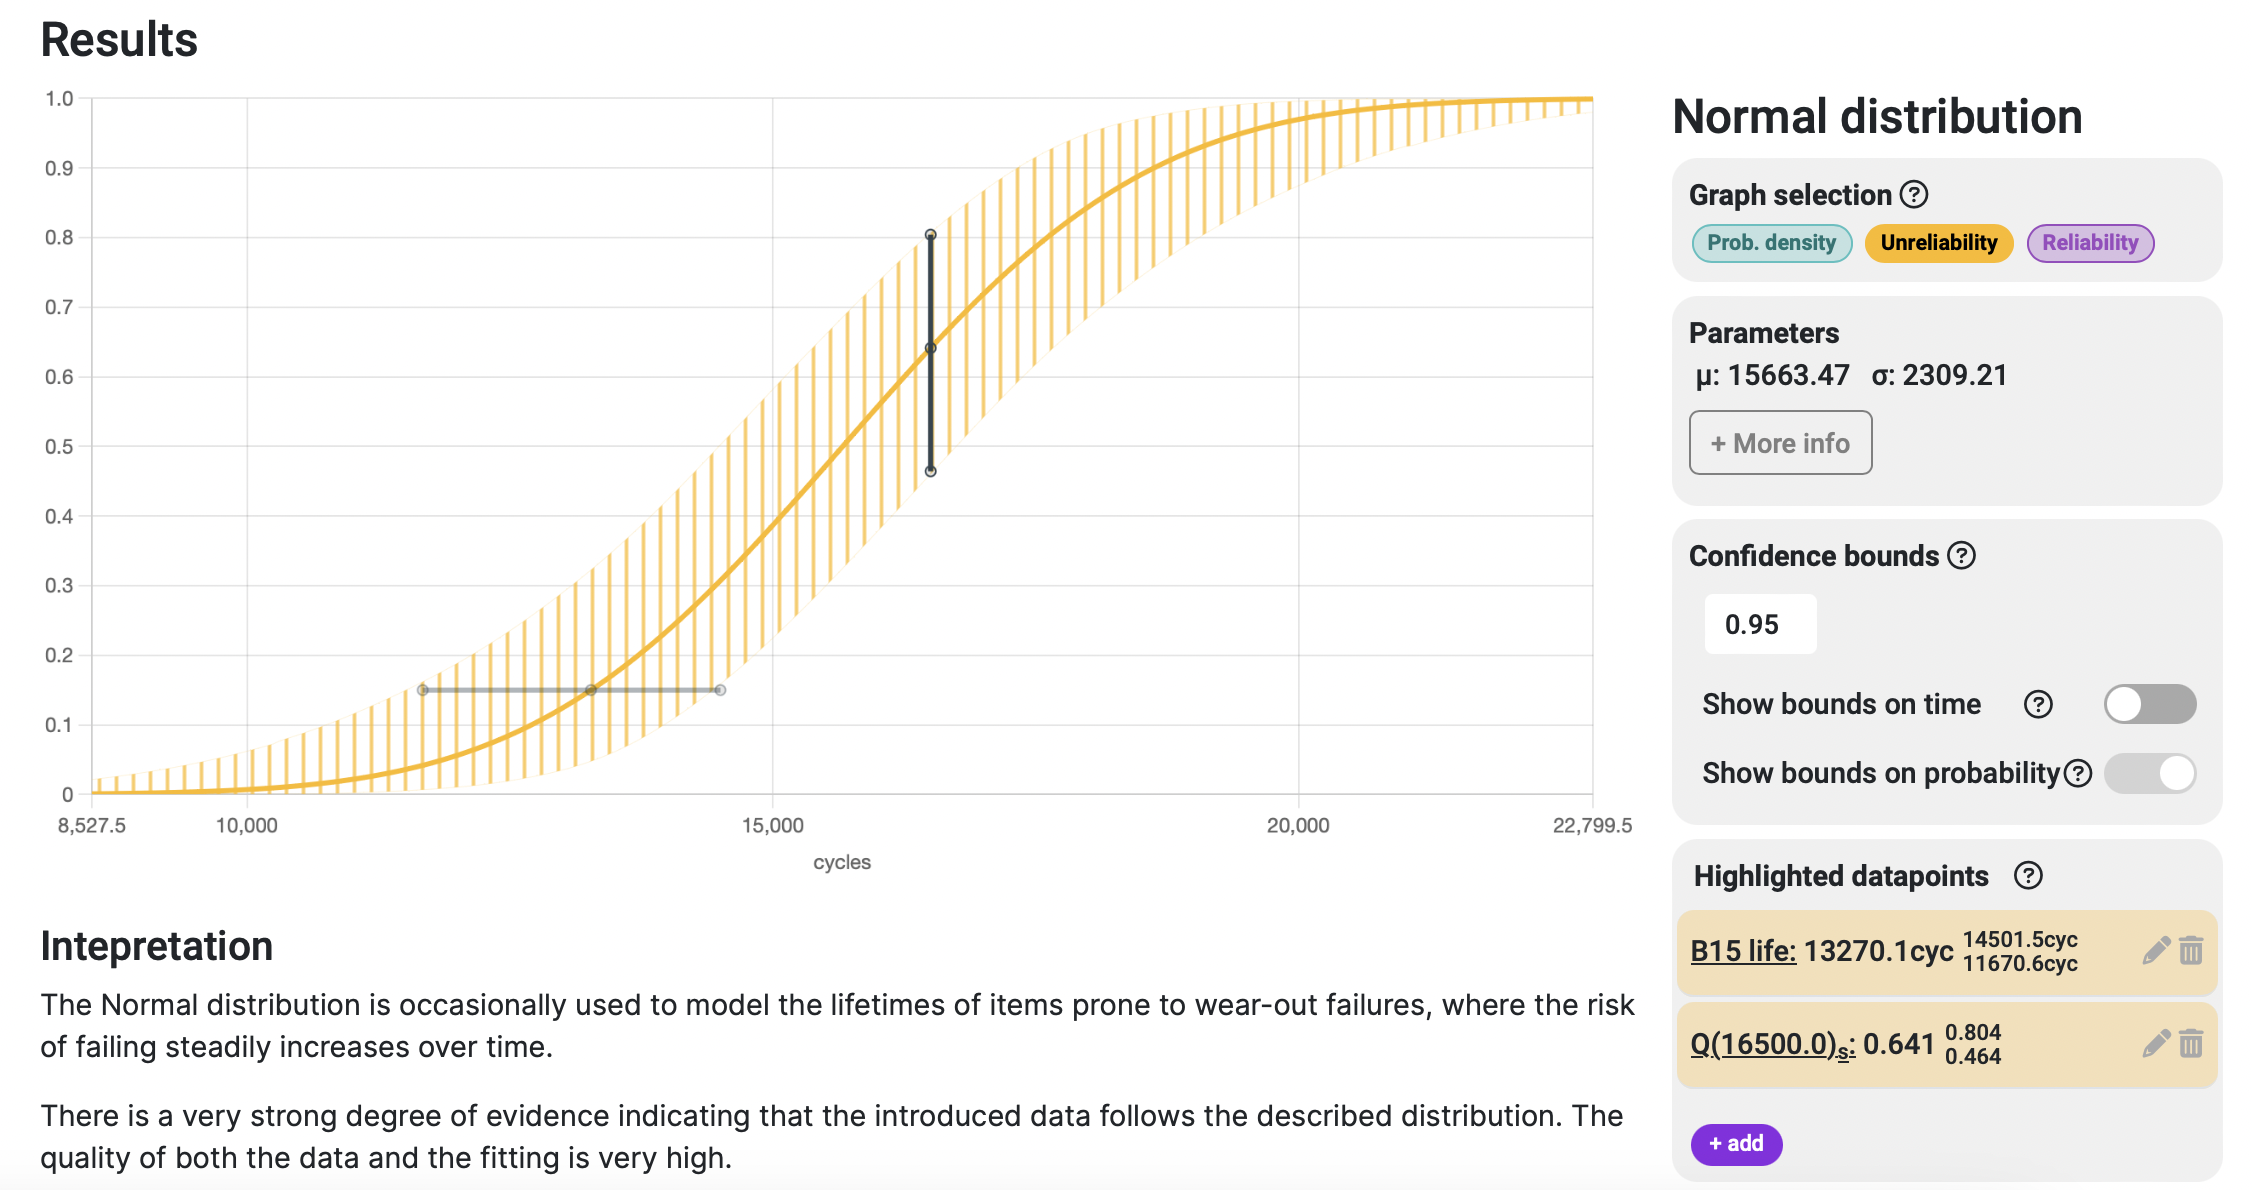
The text result for this highlight point says:
Of a given population, 64% of the samples are not expected to reach 16500.00 cycles of operation. When accounting for confidence variability, this percentage ranges from 46% to 80%.
Meaning that for every 100 machines the agriculture machinery company had sold, 64 of them will not make it to 16500 cycles, and if we evaluate the extreme cases, it could be up to 80 of those that failed in the worst case scenario.
Conclusion
We've seen how to create a project for a system consisting of all failures, addressing a real case where speed of analysis was crucial for a company dealing with a serious field issue. Broadstat proved instrumental in helping them assess the situation and forecast the necessary resources, such as spare parts and personnel, to overcome a crisis before implementing a permanent solution. Furthermore, this company has integrated reliability analysis into their development loop, proactively avoiding situations like the one described in this case study.
