It can be a little daunting to create your first reliability project, especially if you feel like you lack the necessary knowledge or background related to the matter. We've been in that position in the past, and that's why we set ourselves the goal to create a tool that was so easy to use that anybody could perform studies with it, right out of the box. Here, we'll show step by step how a first project is created, what details are important, and what outcome you can expect.
Your case scenario
This is the most important element of you want to perform a reliability study: if you're going to conduct a failure analysis, you are going to need failures that come from somewhere. Your potential sources of failure data come in two different ways:
-
Reactive: You have been receiving calls or messages from customers or service engineers regarding a recurring failure that some of your devices seem to be experiencing at different client locations. This doesn’t look like a coincidence anymore, and you decide to investigate the nature of this failure, and the statistical probabilities that this failure occurs in any of the devices that you have sold to your other clients.
-
Proactive: You are either in the process of developing a new system, an iteration of a previous one, or you simply want to make a quantitative comparison between components in terms of how likely is it to expect a failure from them, causing potential downtime and expensive servicing for your clients. So you decide to run a controlled test in which you make your studied components/subsystems function continuously until they fail, so that you have data to analyse and are able to characterise their reliability performance.
In terms of how the data is treated from this point onwards, there is no difference between the two cases. Not one is better than the other, you have to use the one you have at your disposal, and both can be used in the same project: you can run lab tests during the development phase of a product, and then see if the results get replicated in the field once the failures start appearing.
Create a new project
When you click on the "New project" button on Broadstat, you are asked to fill in a couple of fields that will quickly help you identify the system you are studying in the future:
-
Title: Try to use something that describes the system you are analysing. If you expect to test different variations or revisions of the same system, make it clear in this field so that it’s easy to differentiate which project relates to what.
-
Description: This field should give sufficient information to completely define the system you are dealing with, and the conditions it’s operated under. If a colleague of yours comes across this project, they should be capable of understanding which system you are referring to and other relevant parameters like firmware version, system revision, operating pressure (if applicable), etc.
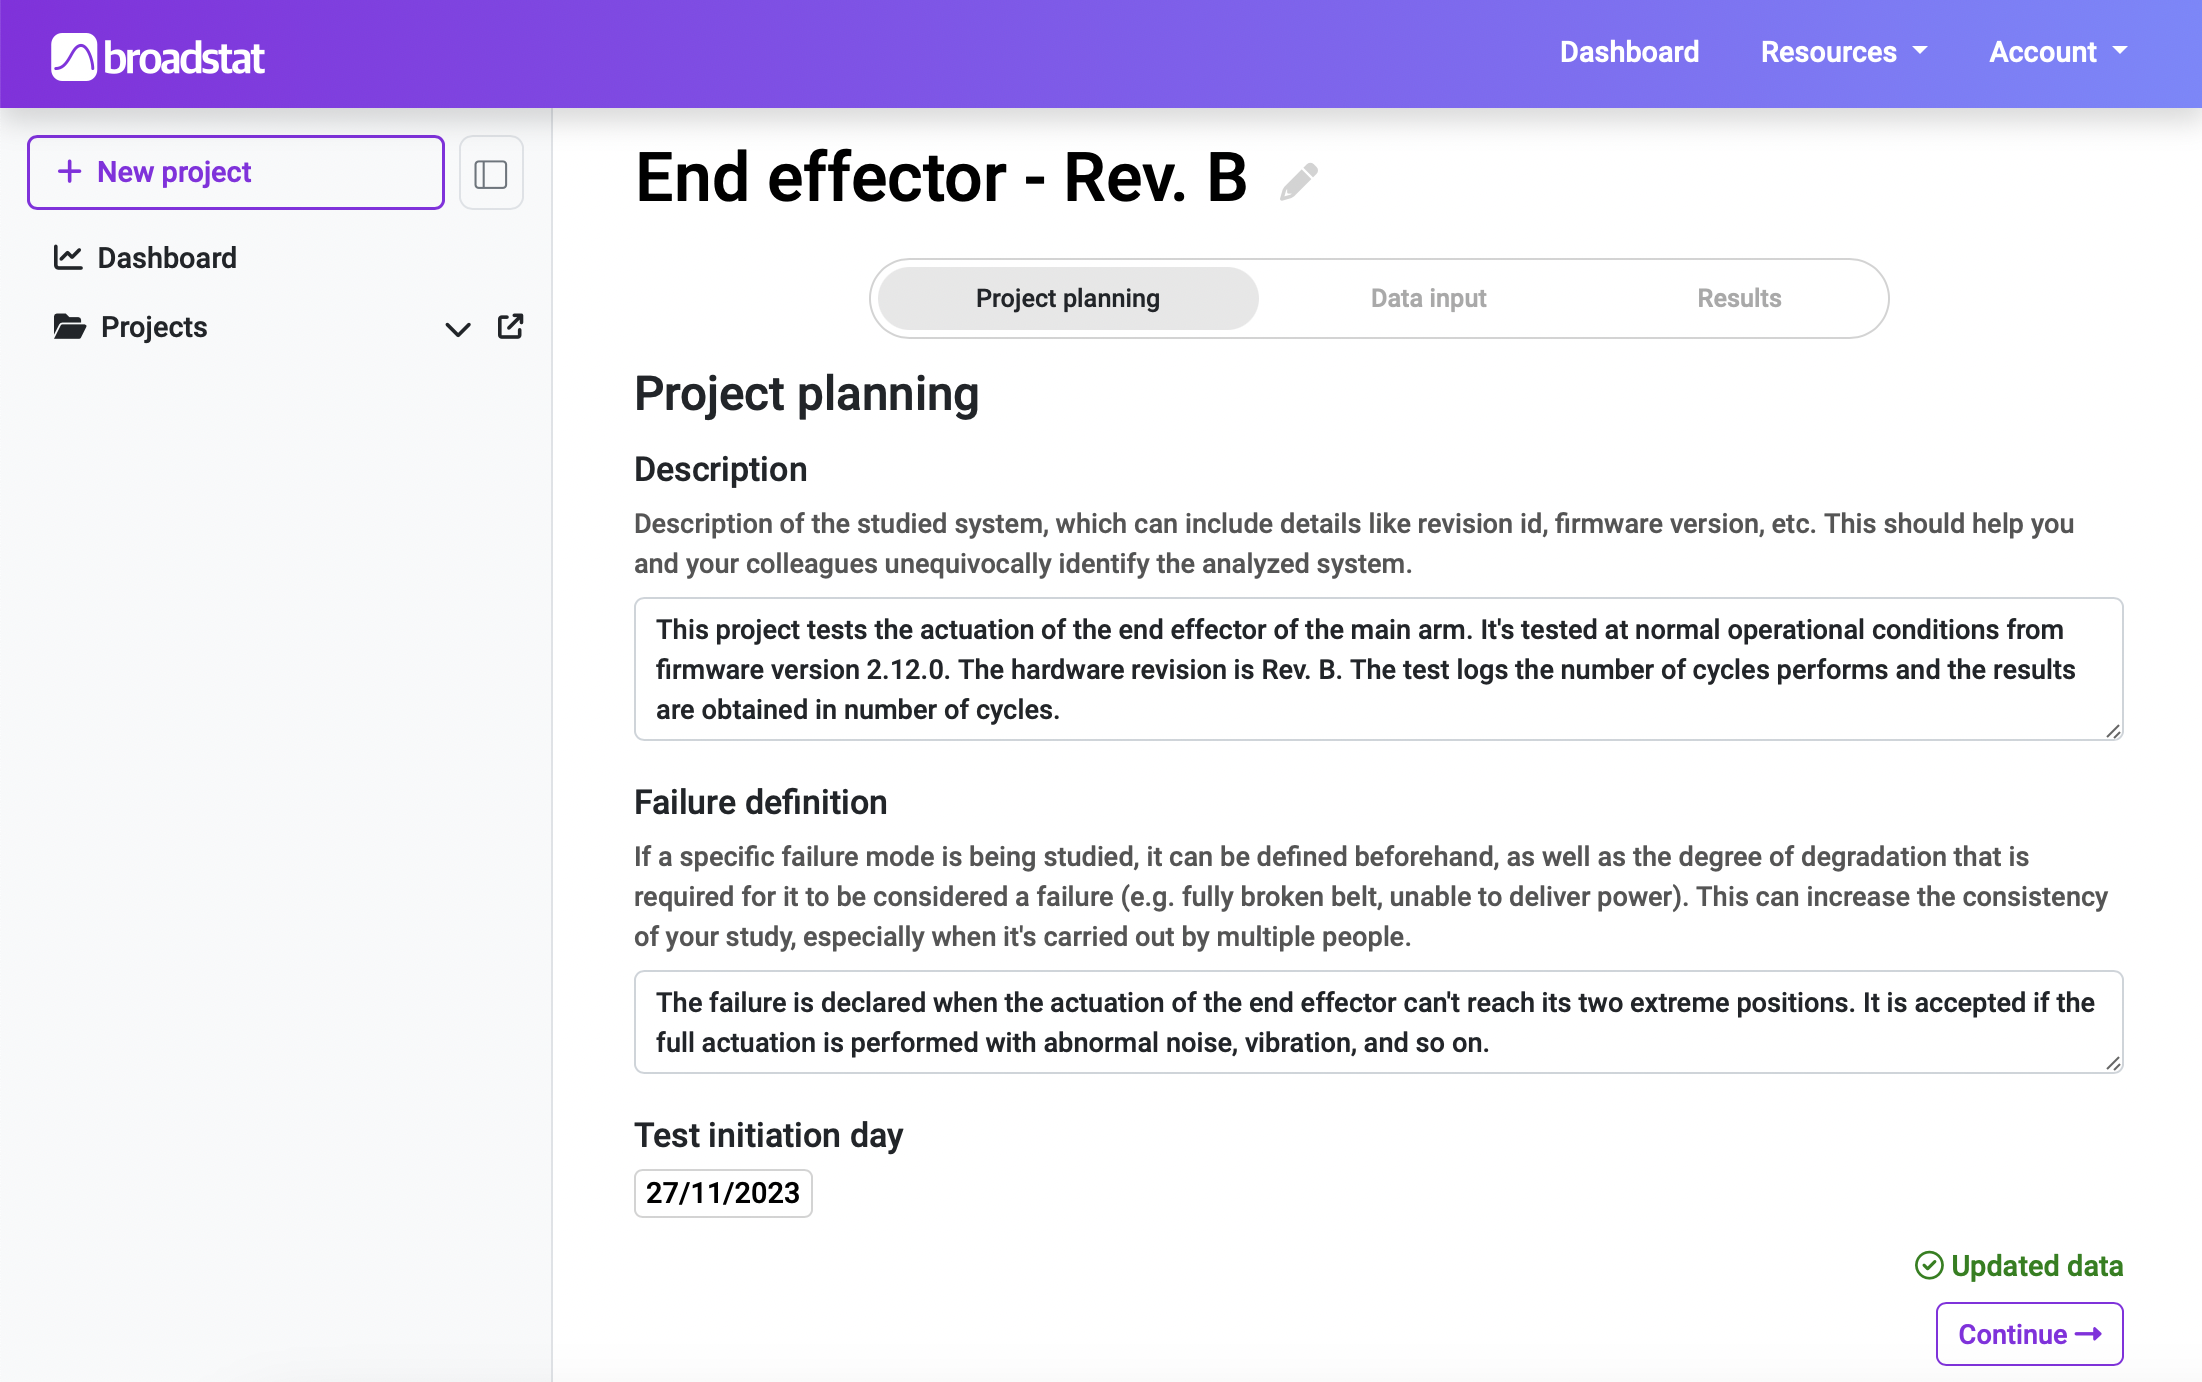
After creating the project, you are sent to its first section, which completes the above mentioned information with a few more descriptive fields:
-
Failure description: This field is extremely useful when several people are working on the same study, as there are multiple interpretations and thresholds to what can be considered a failure. It is also useful even if there’s only one person working on the study, as it helps with consistency for your test.
-
Test initiation day: Even though this parameter may not be necessary to perform the study, it can be useful if you want to track some values like average test duration, for example.
Data input
In this section you can click the “+” button to add new failure-data instances. These instances, as we explained at the beginning of this post, can come from real on-the-field occurrences or from controlled lab tests. There are a couple of variations in input data types besides a standard failure value:
-
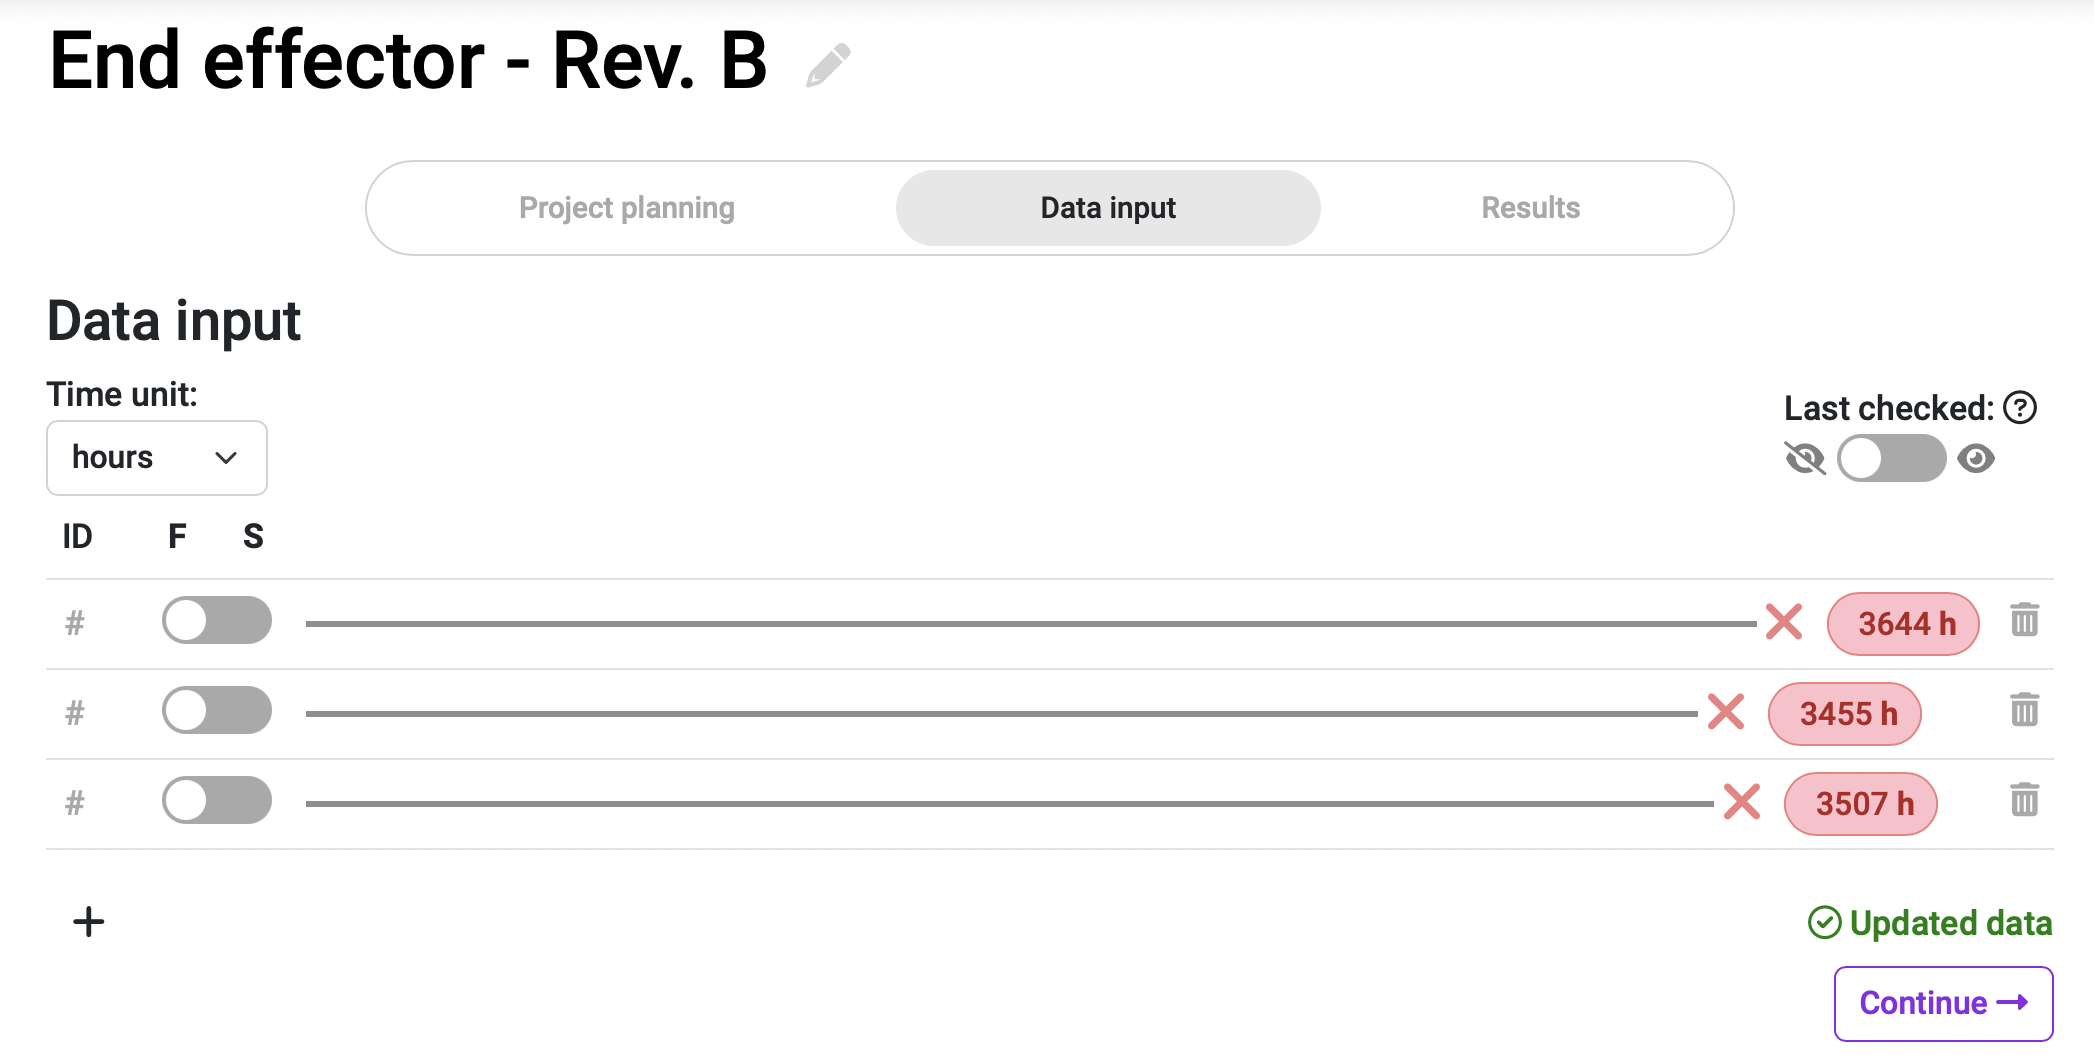
Exact failure data: This is the type of data that people tend to think of when it comes to reliability analysis. When a component fails and we know exactly the moment in which it did, we have an exact failure occurrence. If this is the case for you, make sure to switch off the “Last checked” selector, and that the F/S one is set to F (for Failure).
-
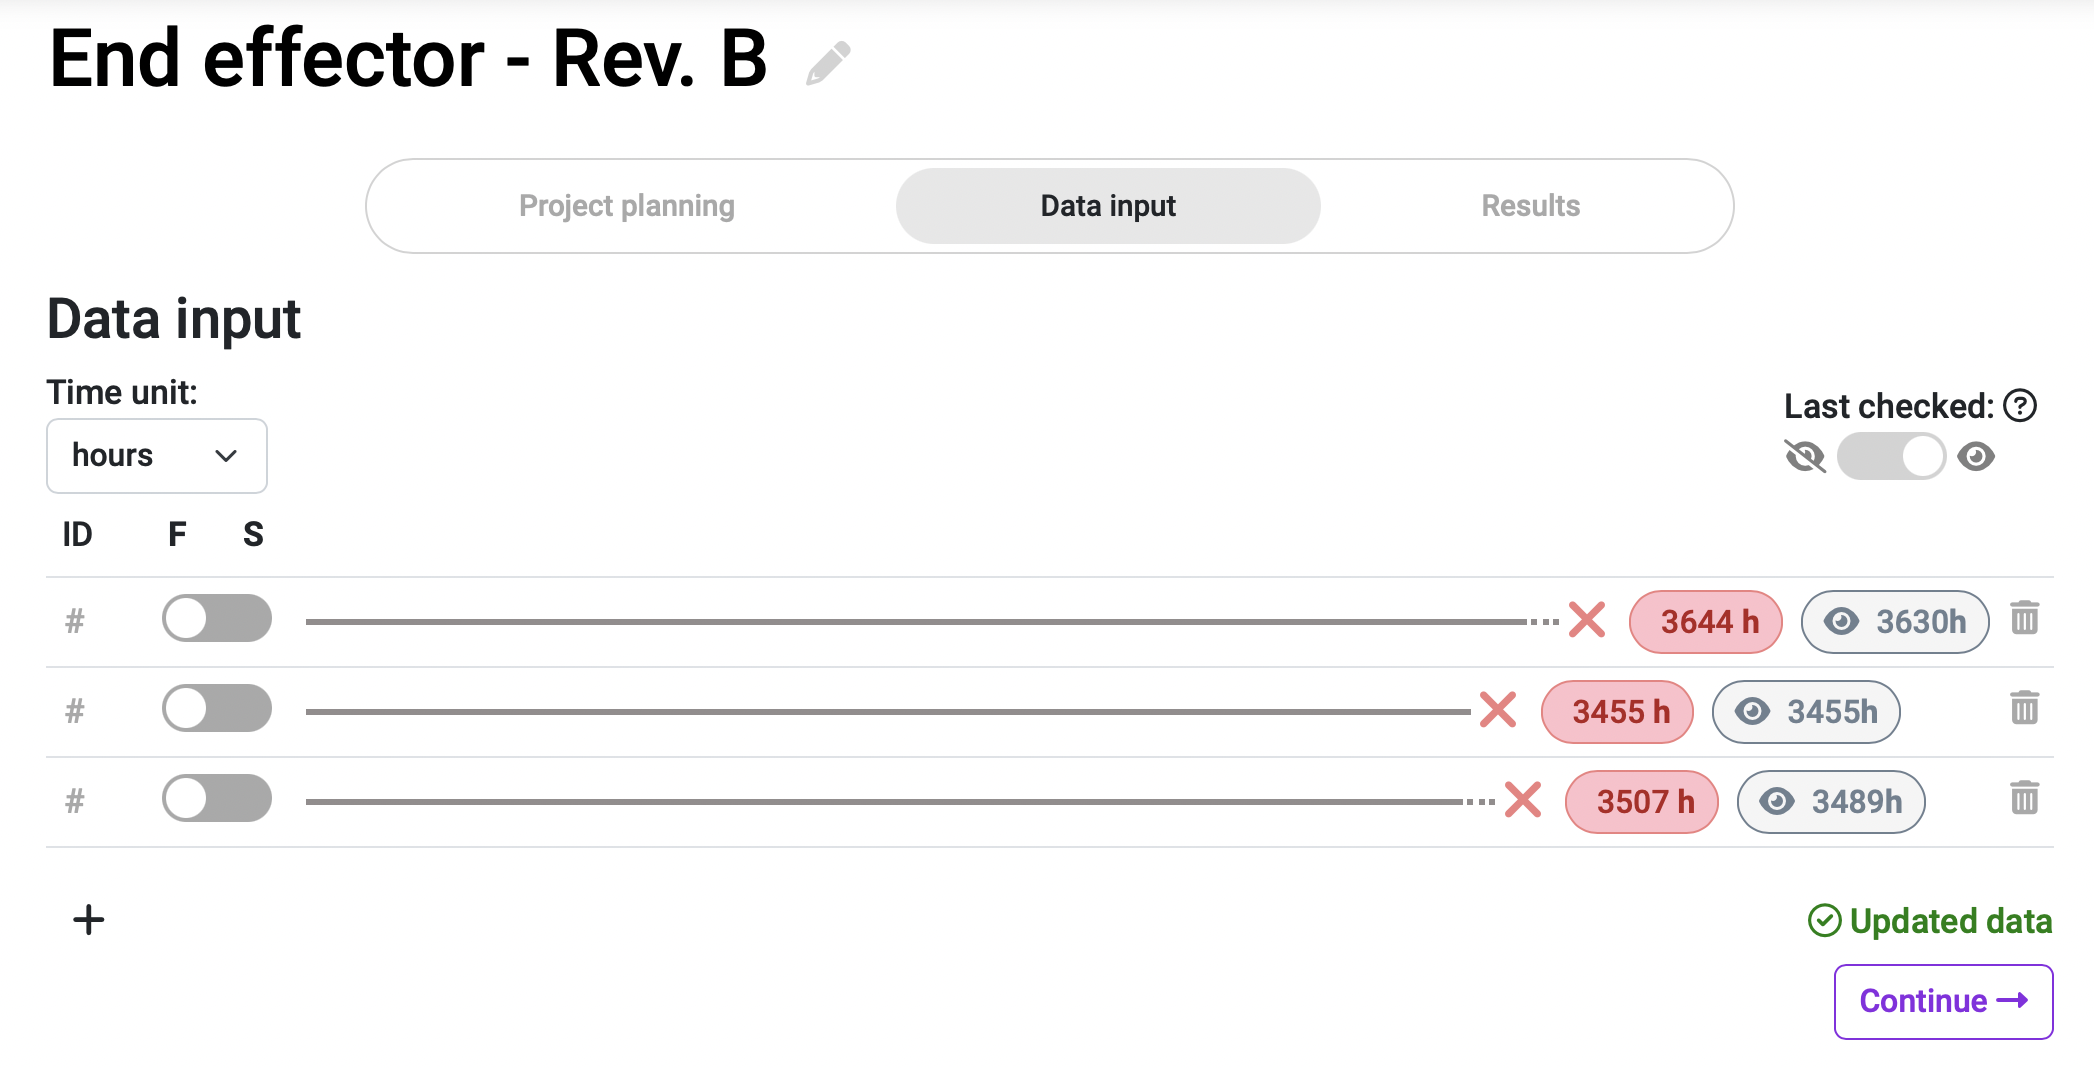
Interval data: In many occasions, when a system fails we are capable of pinpointing the exact moment of failure and use exact failure data. But in other cases, we can just be sure the failure happened within a temporal interval: if you check your samples periodically, and you detect a new failure, you know that it happened sometime between the moment of detection and the last time you checked the samples (at which time it was still functioning). If this is the case for you, you can select the “Last checked” switch at the top-right area of your Data input section. This will allow you to type the failure detection value (in red), and the last checked value (the last time you saw it functioning; in grey), for each failure you input.
-
Suspension data: It may happen that a stress test needs to be cut short due to schedule necessities, for example, and some of the samples that were undergoing the test don’t reach their failure points. These are called suspended samples, or suspensions, and even though they haven’t failed, they still can offer some valuable information about the system’s reliability. To input a suspension in your project, use the switch F/S (Failure/Suspension) and introduce the time at which the sample was removed from the test. If you want a more in-depth explanation about suspensions, you can check our suspensions article.
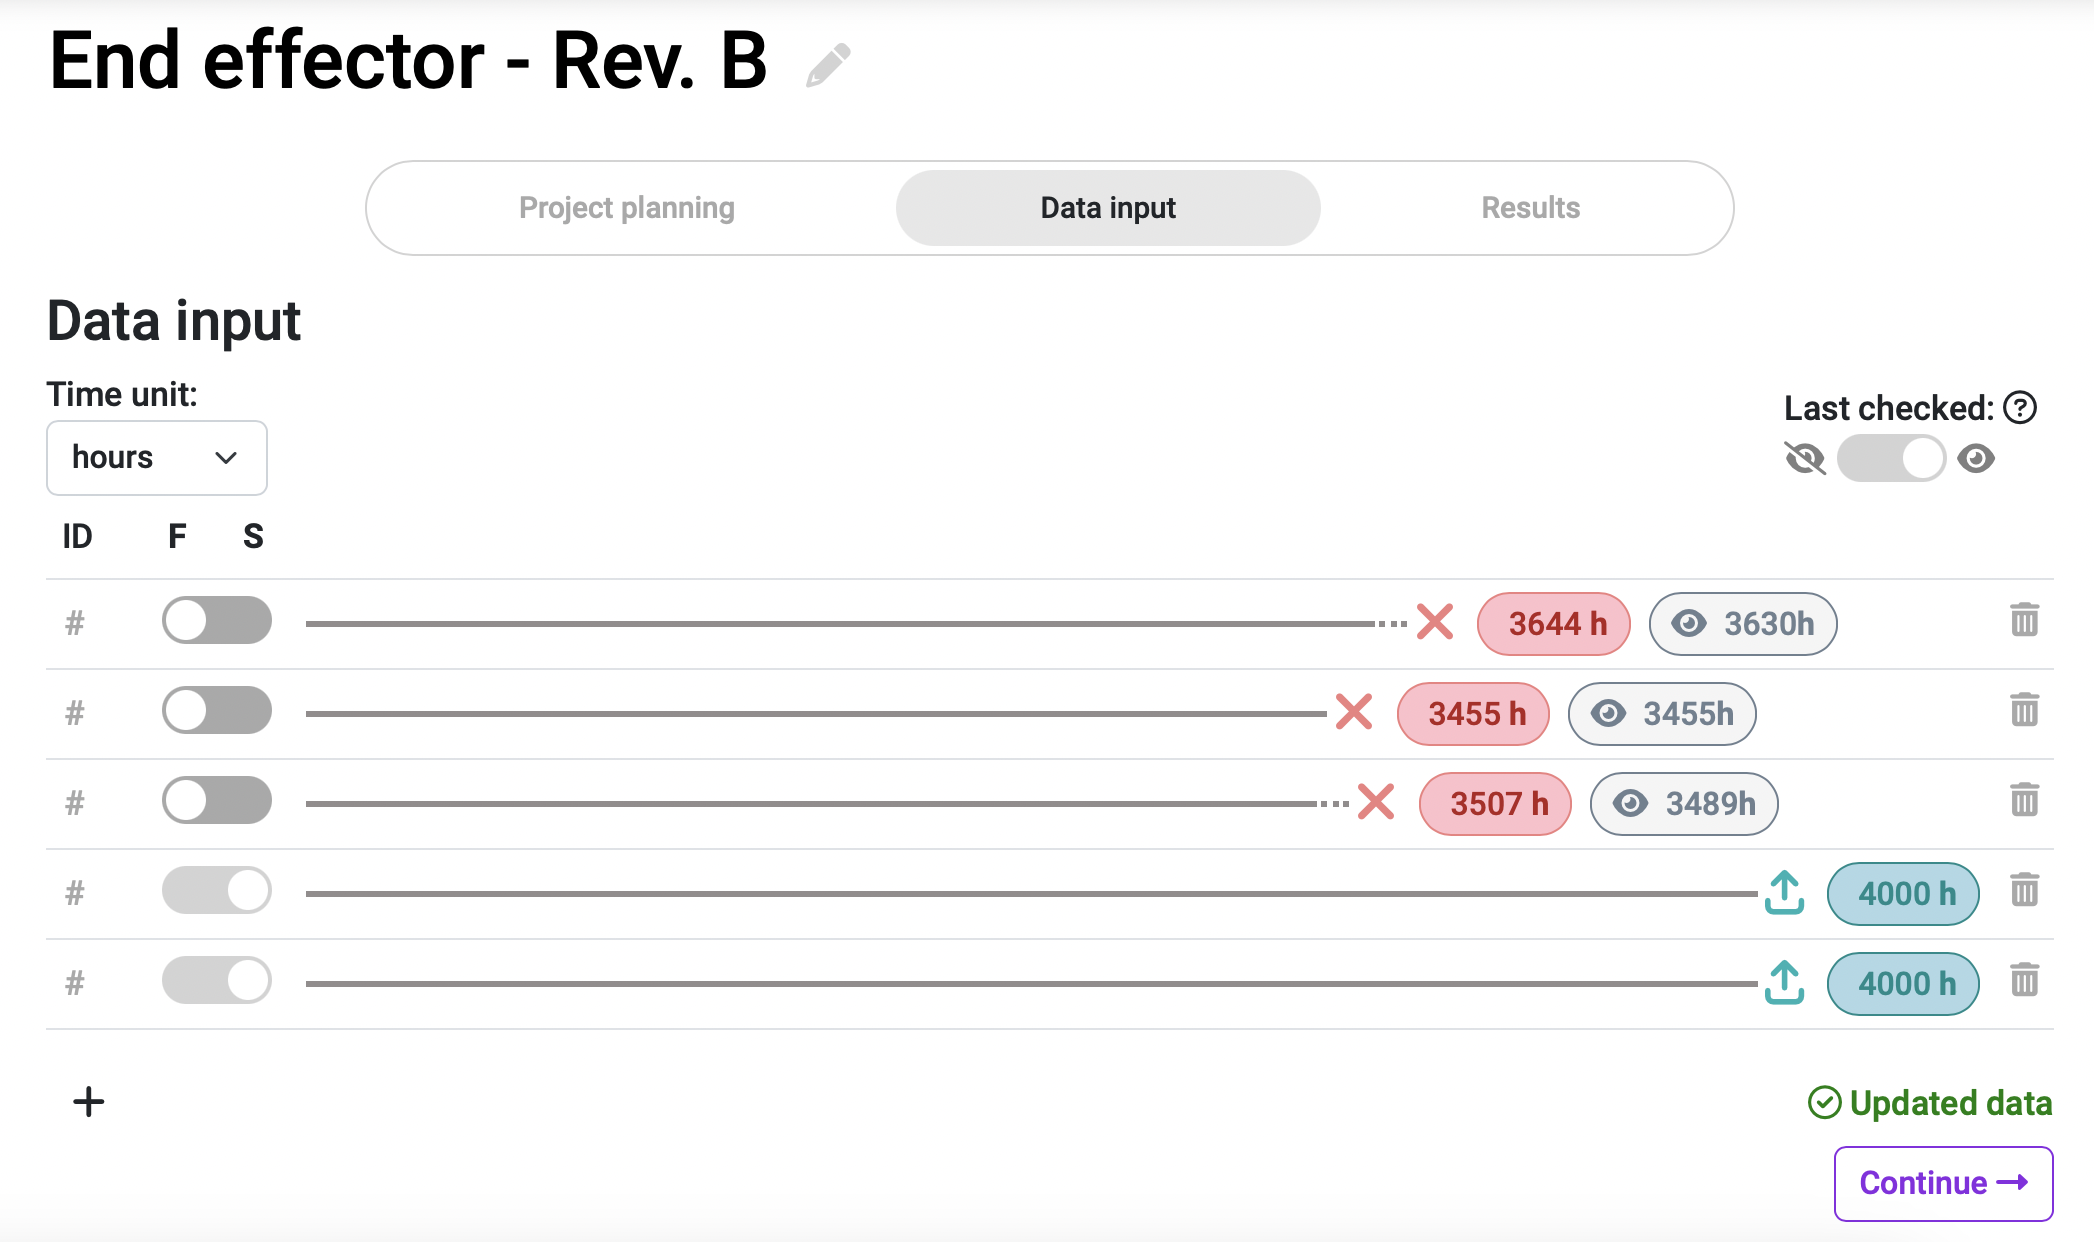
When it comes to data in reliability tests, the more the better: your results will be more accurate, and the confidence margins will be narrower. On the other hand, the bigger the test sample size, the more money it tends to cost (more broken samples, more personnel hours, etc). The key is to find a sweet spot in which the economic investment is acceptable and the accuracy of your results are sufficient. At Broadstat we recommend having at least 10 datapoints per study, but some results may be obtained with even less than that, and prioritise failures over suspensions.
Results
Once you have introduced all your failure data in the Data input section, you can click the “Continue” button to automatically calculate your project results. The first type of results you’ll notice are the graphs:
-
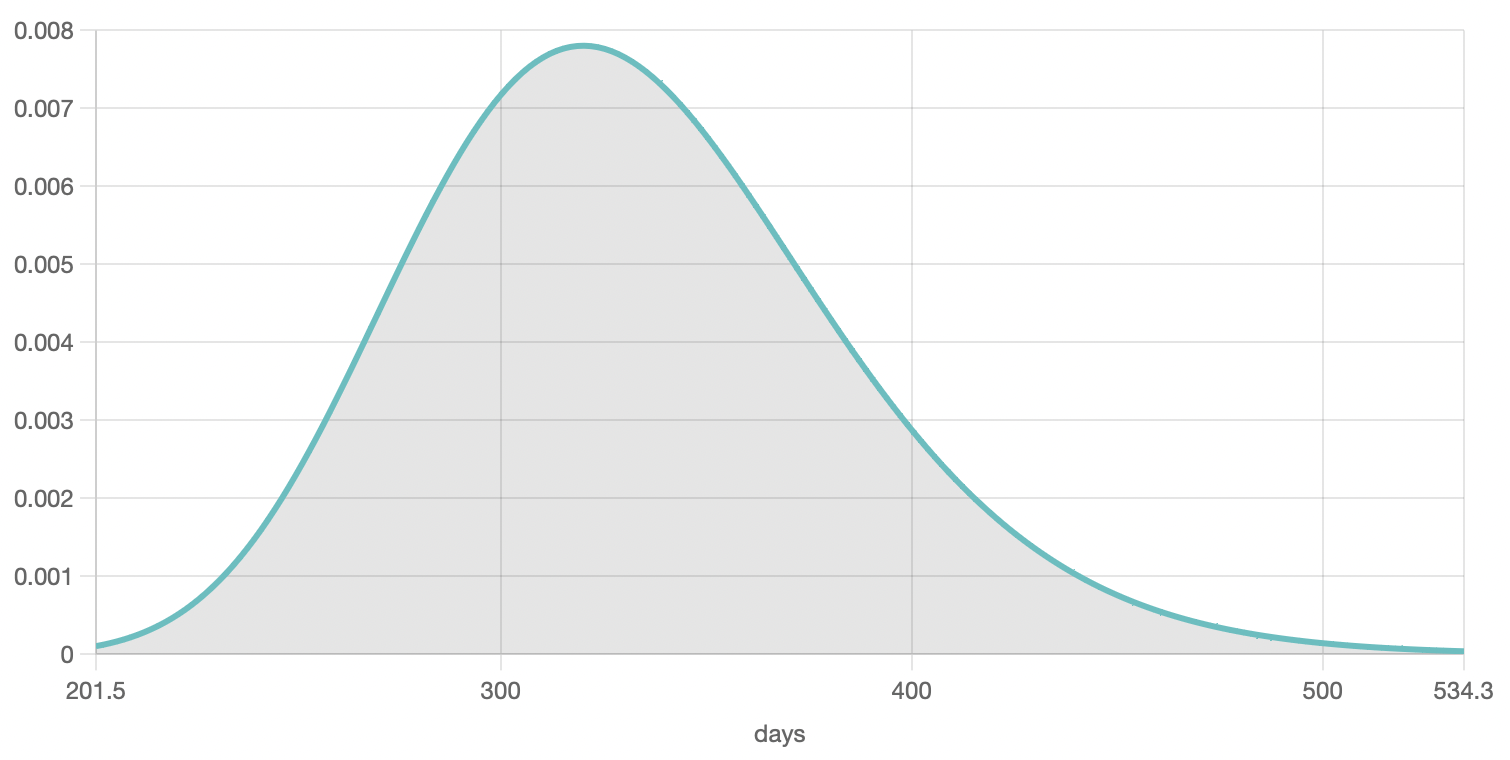
Probability density function: this green curve shows the probability of failure, at any given time, of your system.
-
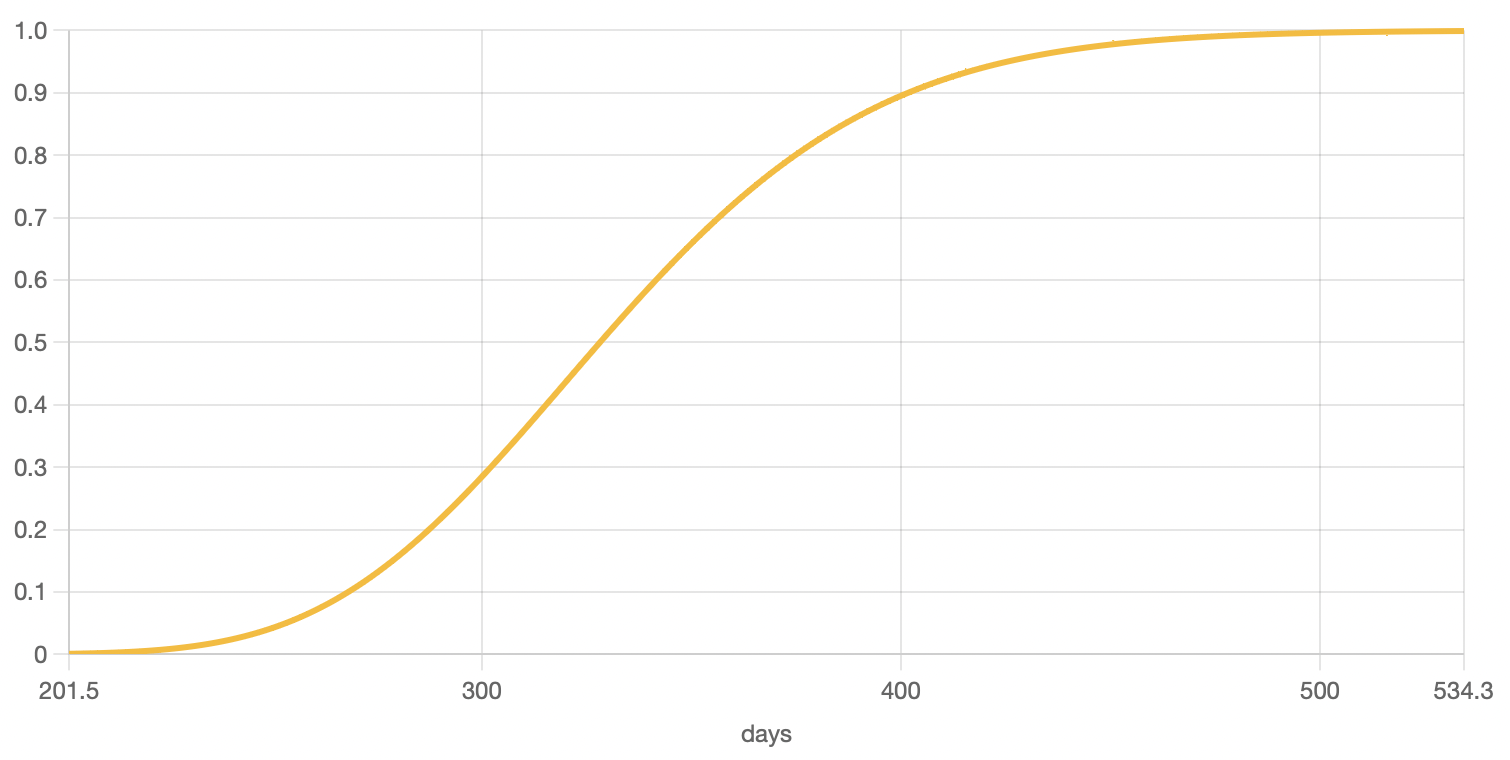
Unreliability function: this yellow curve shows the accumulated probability of failure, from 0 to 1, over time. It is expressed in a per unit basis, meaning that a value of 1 is equal to 100% probability of failure. This curve is always growing (up and to the right) because the probability accumulates over time.
-
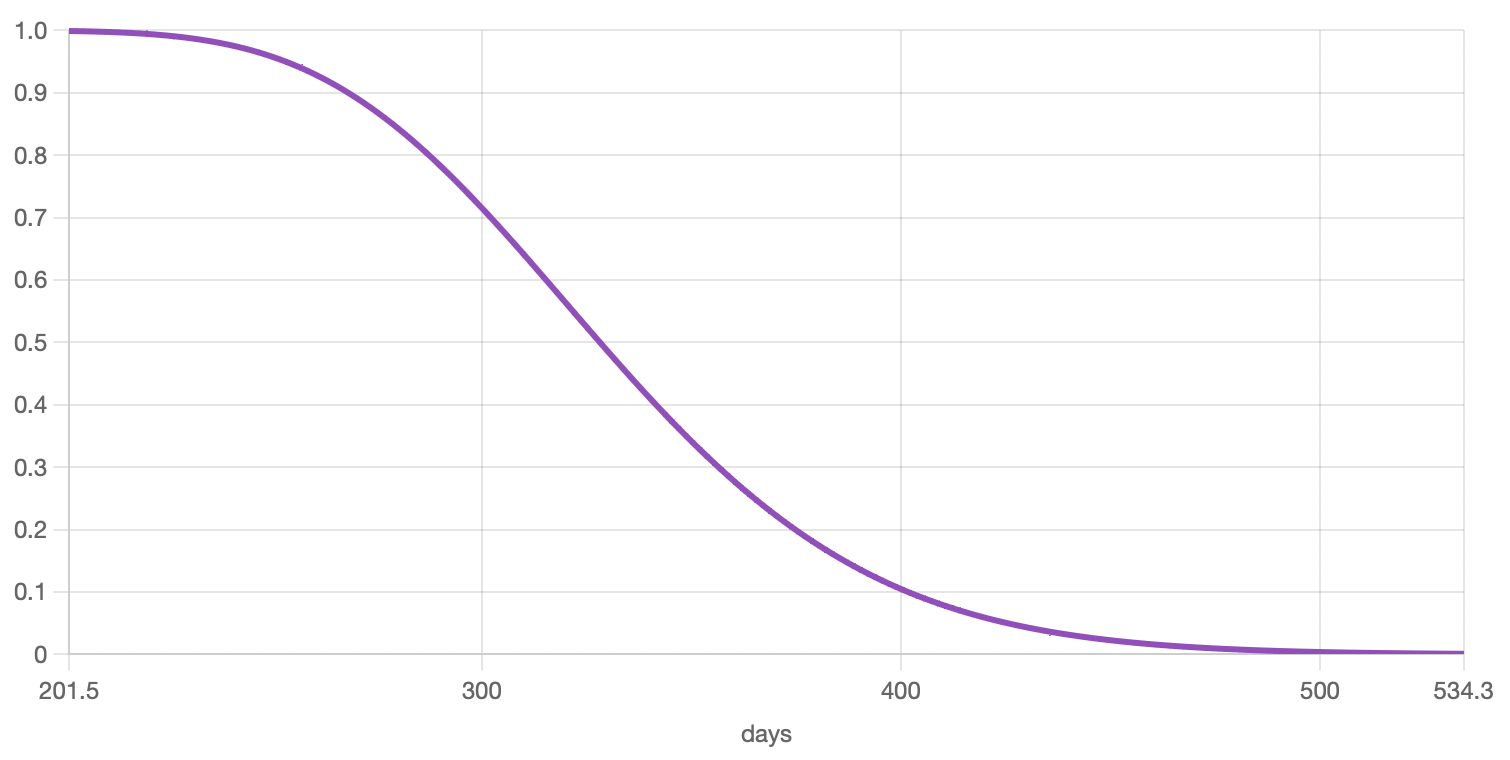
Reliability function: this purple curve shows the probability of survival, from 1 to 0, over time. It is literally the inverse of the unreliability function, and shows the probability of not having failed over time.
On the right panel of your Results section, besides being able to choose the different graphs, you’ll also see the following information/options:
-
Distribution info: you can see which statistical distribution fits your data, together with its corresponding parameters. You can also check how well your data fits to the resulting distribution, and which fitting method was used.
-
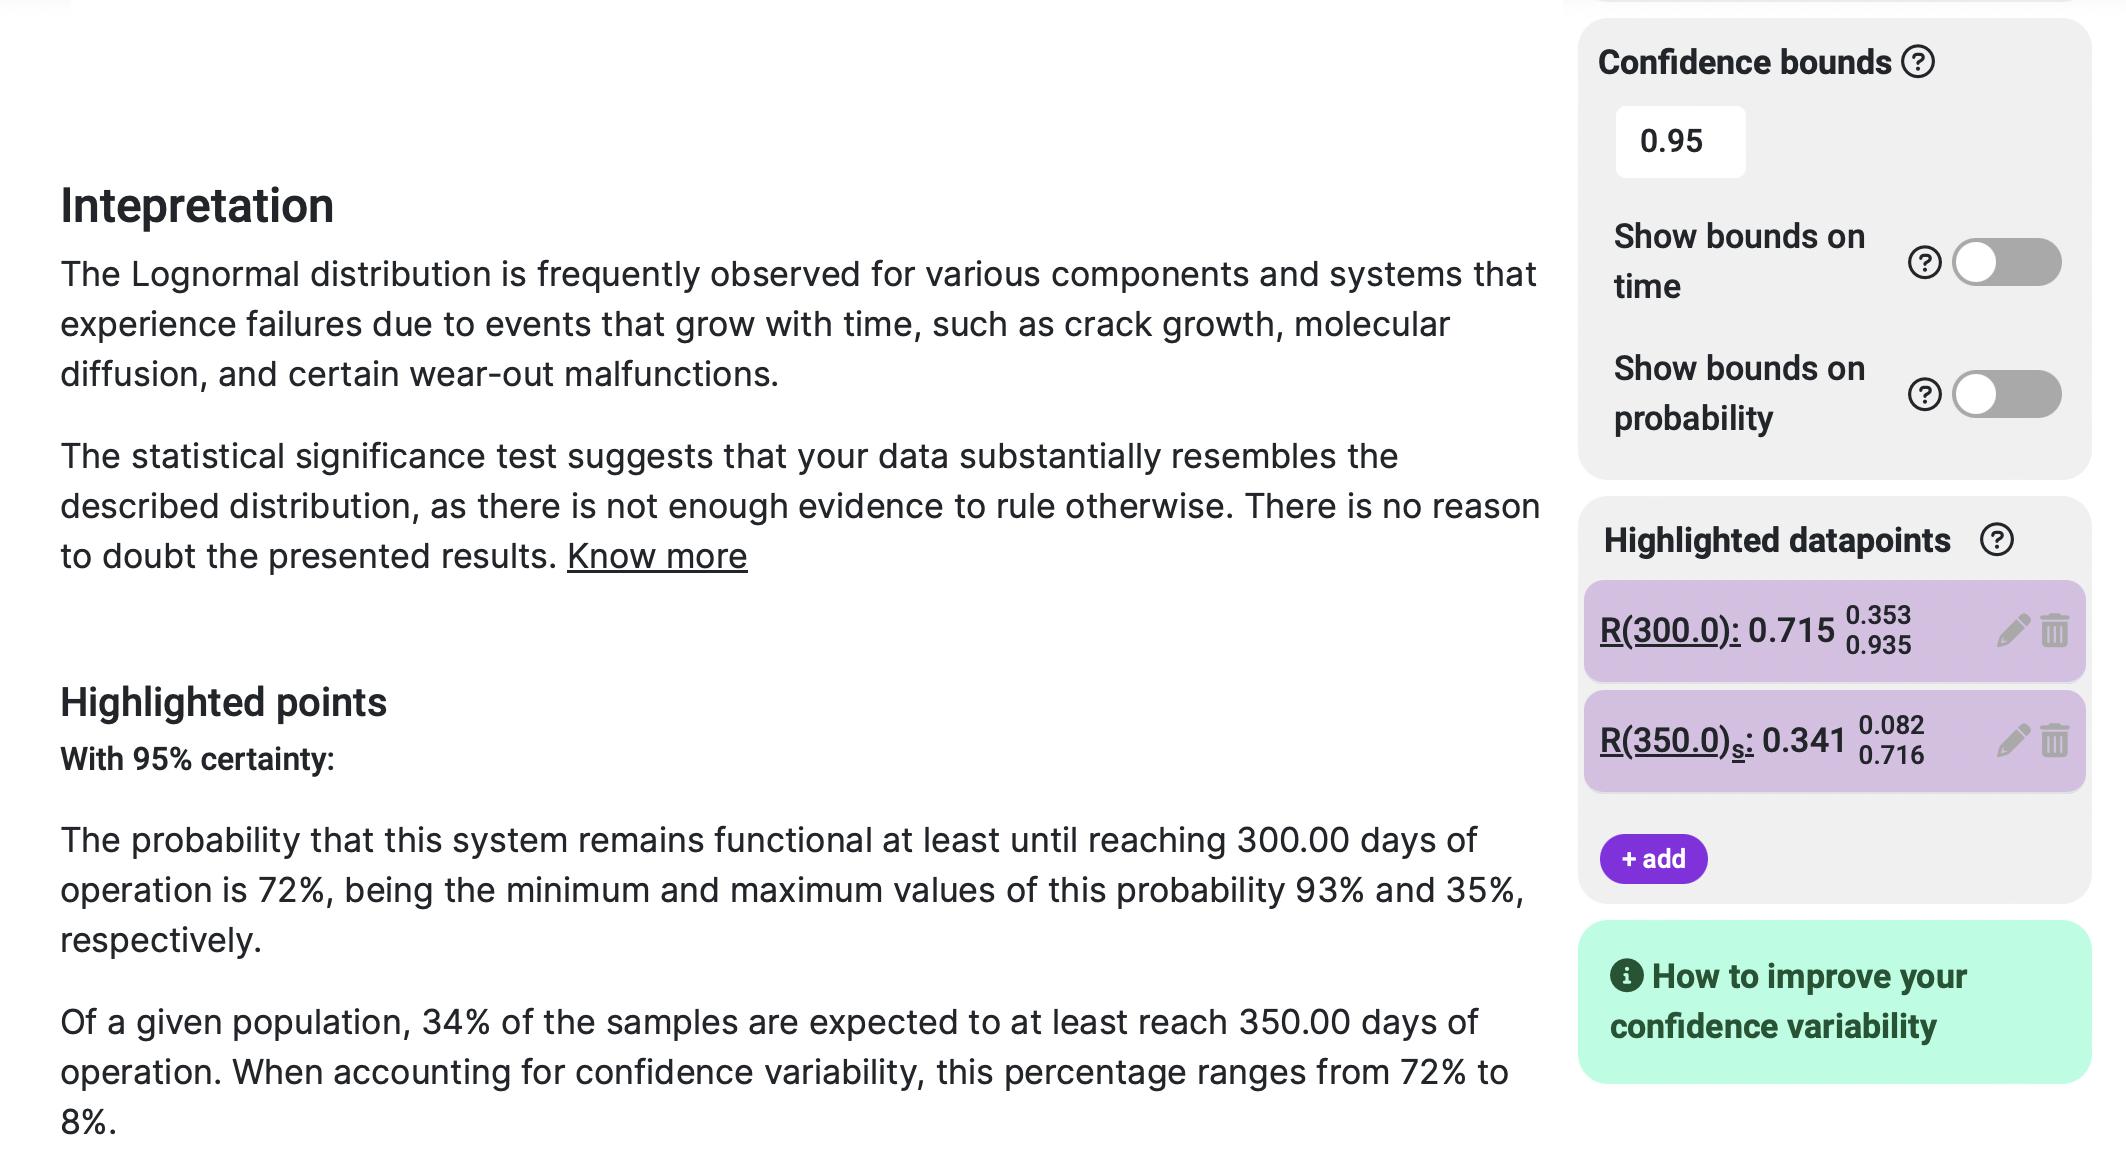
Confidence bounds: you can select your confidence bounds value or, in other words, select which degree of certainty you want to have from the project results. A typical value is 0.95, or 95% certainty that the displayed results are within the plotted bounds. To get more information about this topic, we suggest you visit our confidence bounds article.
-
Highlighted datapoints: you can ask as many as you want of our preset questions via the highlighted datapoints, to get more specific information about your system. An example would be “I want to know the probability that my system fails before reaching 10,000 cycles of operation”. The answer to this preset questions will be displayed both in the human-readable results section and as datapoints in the corresponding graphs.
-
Results interpretation: besides the above mentioned highlighted datapoints results in human-readable format, this section also shows an easy-to-understand summary of all the information your results section has to offer.
