In the realm of statistical analysis, there is no such thing as an exact result. The data we operate with helps us determine the probabilities of an event happening, and it is up to us to decide if the level of certainty that such probability gives us is sufficient to take certain actions. In reliability analysis, as in other disciplines related to statistics, the level of certainty we have over a result is represented by what's known as the Confidence Bounds.
What are the confidence bounds?
When we introduce our failure data into the reliability calculation algorithms, the probability distribution is calculated by finding the parameters that best explain such data. However, calculating this distribution is just half of the job, as we still need to get a feeling of how accurate the results are. An example to illustrate this makes it clearer:
So for the next 5 days, you go to the park and write down the times in which you see Sammy show up at the park. There is certain variability to these times, so you fit the values to a statistical distribution, and calculate the 10 minutes in which the probability of Sammy being walked are the highest. Would you feel confident enought to call your friend and make the guess? I mean, five days are not that many to draw certain conclusions if I'm betting my money over them. Instead of that, you choose to wait and check on Sammy's walk every afternoon for a full year, and with all that data you calculate again, and decide to call your friend. This time again, you calculate the 10 minutes with highest probability of ocurrence and make your guess, except this time you are way more confident on your guess than last time because you have a lot of data to support your answer.
As you may imagine, this doesn't mean that your initial guess after five days would've been incorrect, but in that situation you may have relied more on luck than probability. It's also not a guarantee that you would win the bet after a year of observations, but in that case your chances of winning were way higher than before.
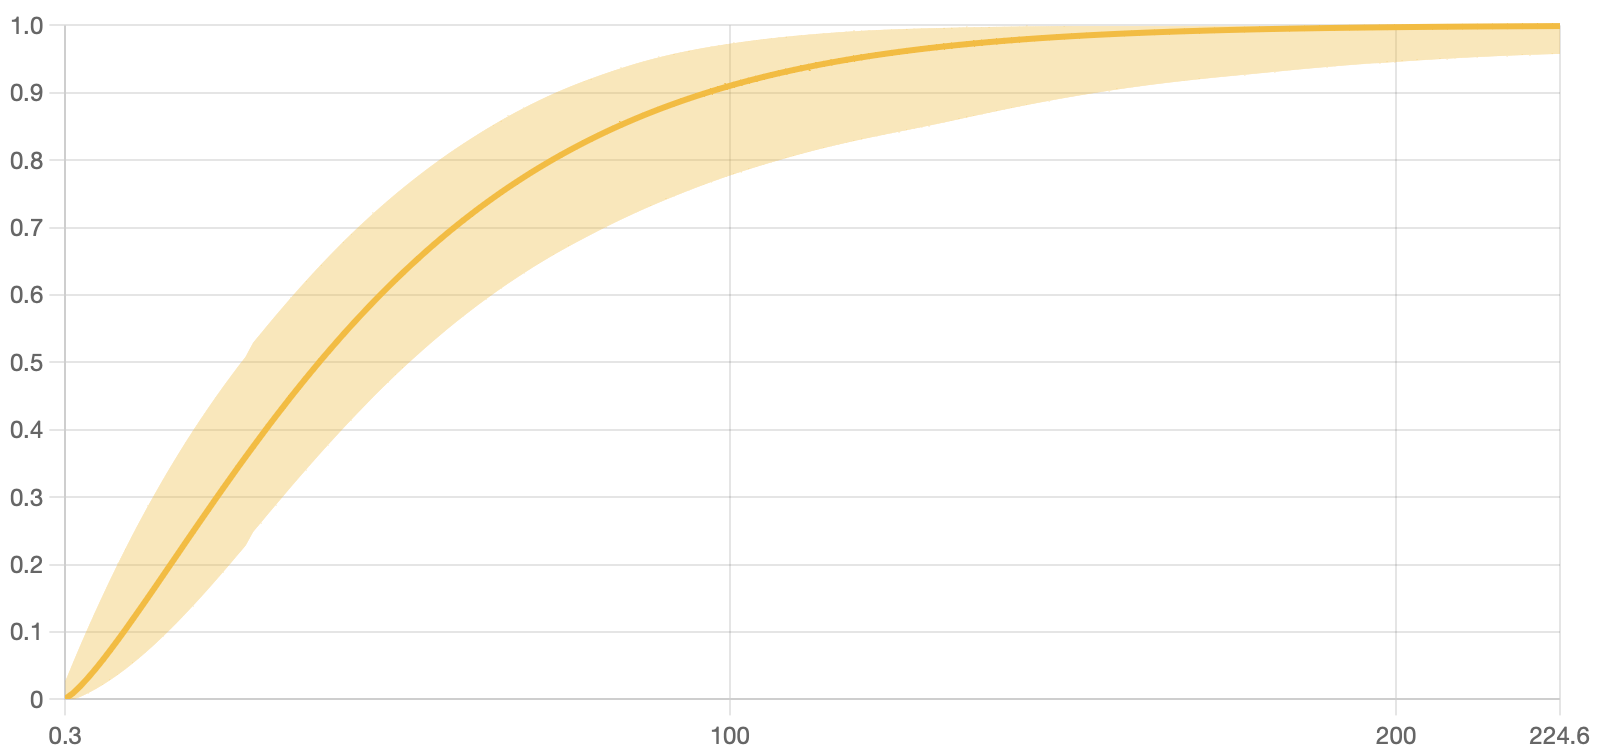
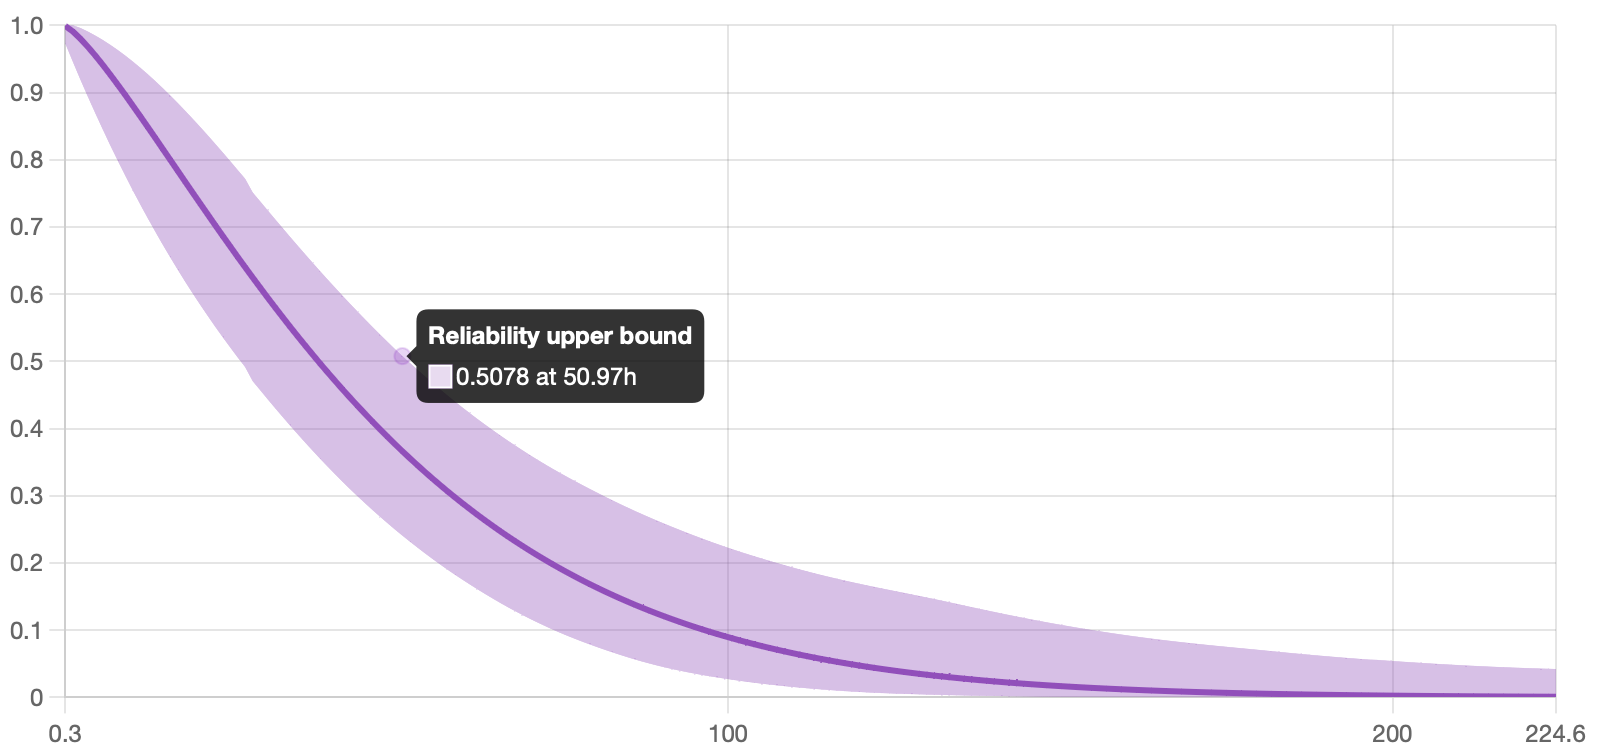
You should know that the level of confidence one has in their statistical results is not necessarily based on intuition alone. There are mathematical and/or computational methods to calculate the actual limits, or bounds, within which the results can be trusted with a certain degree of certainty. These bounds can be overlaid on top of the nominal results, creating a band or strip (also known as a confidence interval) that contains the range of values where the true values may lie.
What affects the confidence bounds
As a reliability analyst, there are two knobs you can turn that affect the width of the confidence intervals.
Sample size
As seen in the example above, the number of data points included in a study can significantly impact the confidence one can extract from its results. The more failures (or even suspensions) a study has, the narrower the confidence interval will be. On the other hand, having too few datapoints in your study may result in an interval so wide that its results become unhelpful.
Degree of certainty
This could be translated to "How sure you want to be of your results?" But wait a minute, this sounds like a trap question! In practice, what this means is that the more certain you want to be about your results, the wider the interval will become to ensure that the real value is "somewhere within there." As this might seem like a subjective parameter to choose, it is common to use one of the industry standards: 0.99, 0.95, or 0.9; and stick to the same value for all your projects, making them as comparable as possible. See the impact of choosing a 0.99 vs. 0.85 certainty value in the image below.
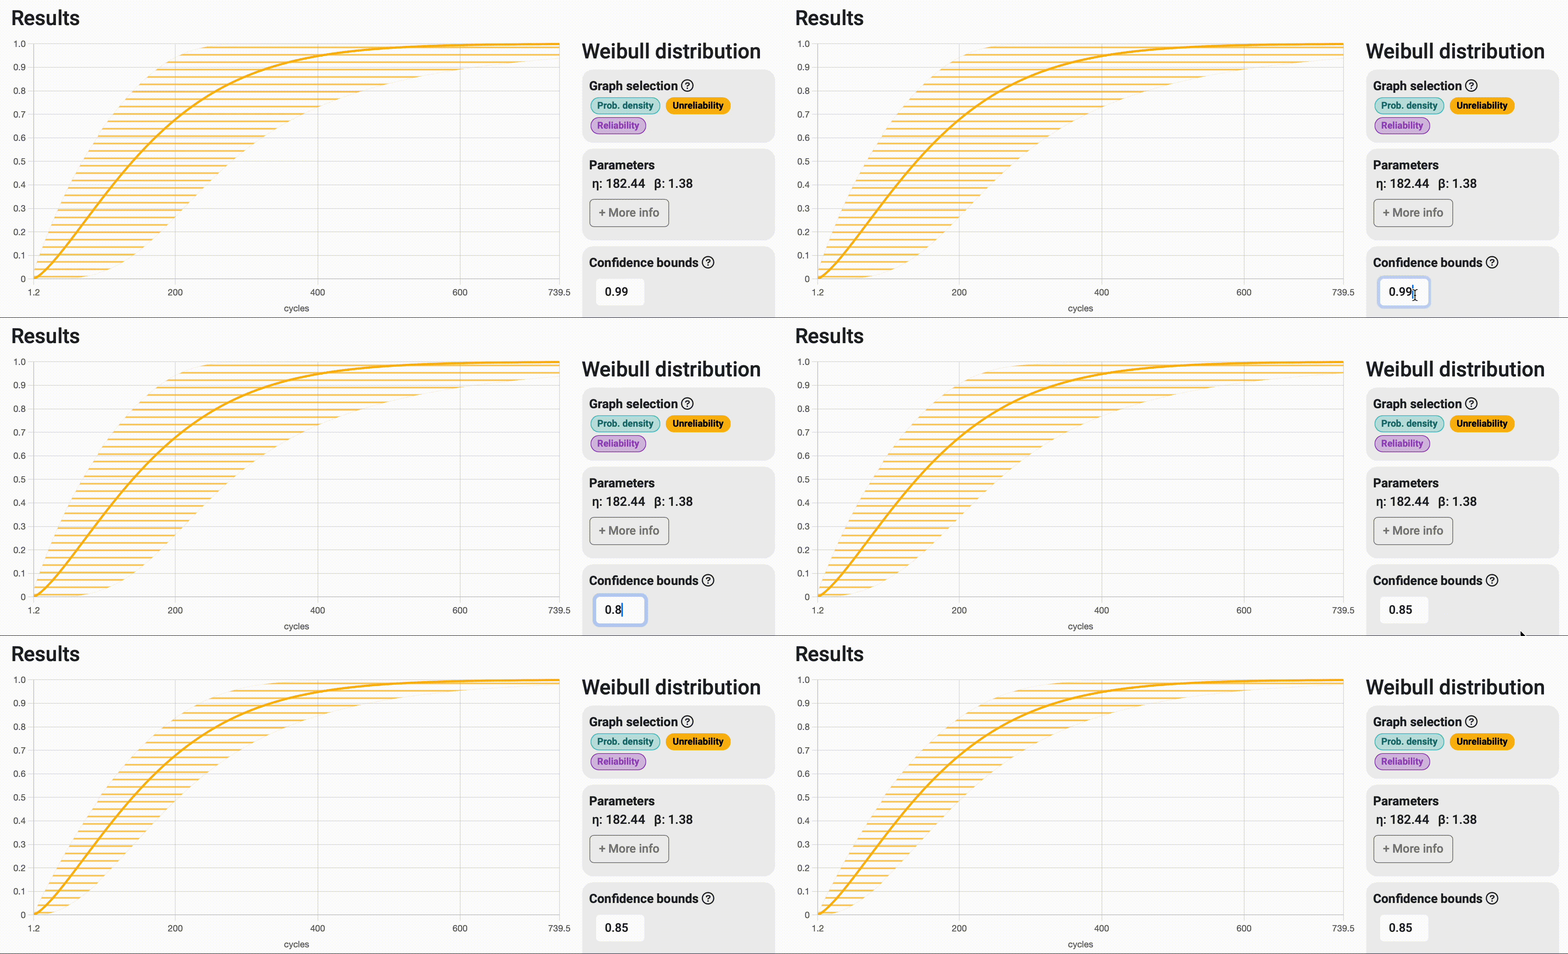
Bounds on time / Bounds on probability
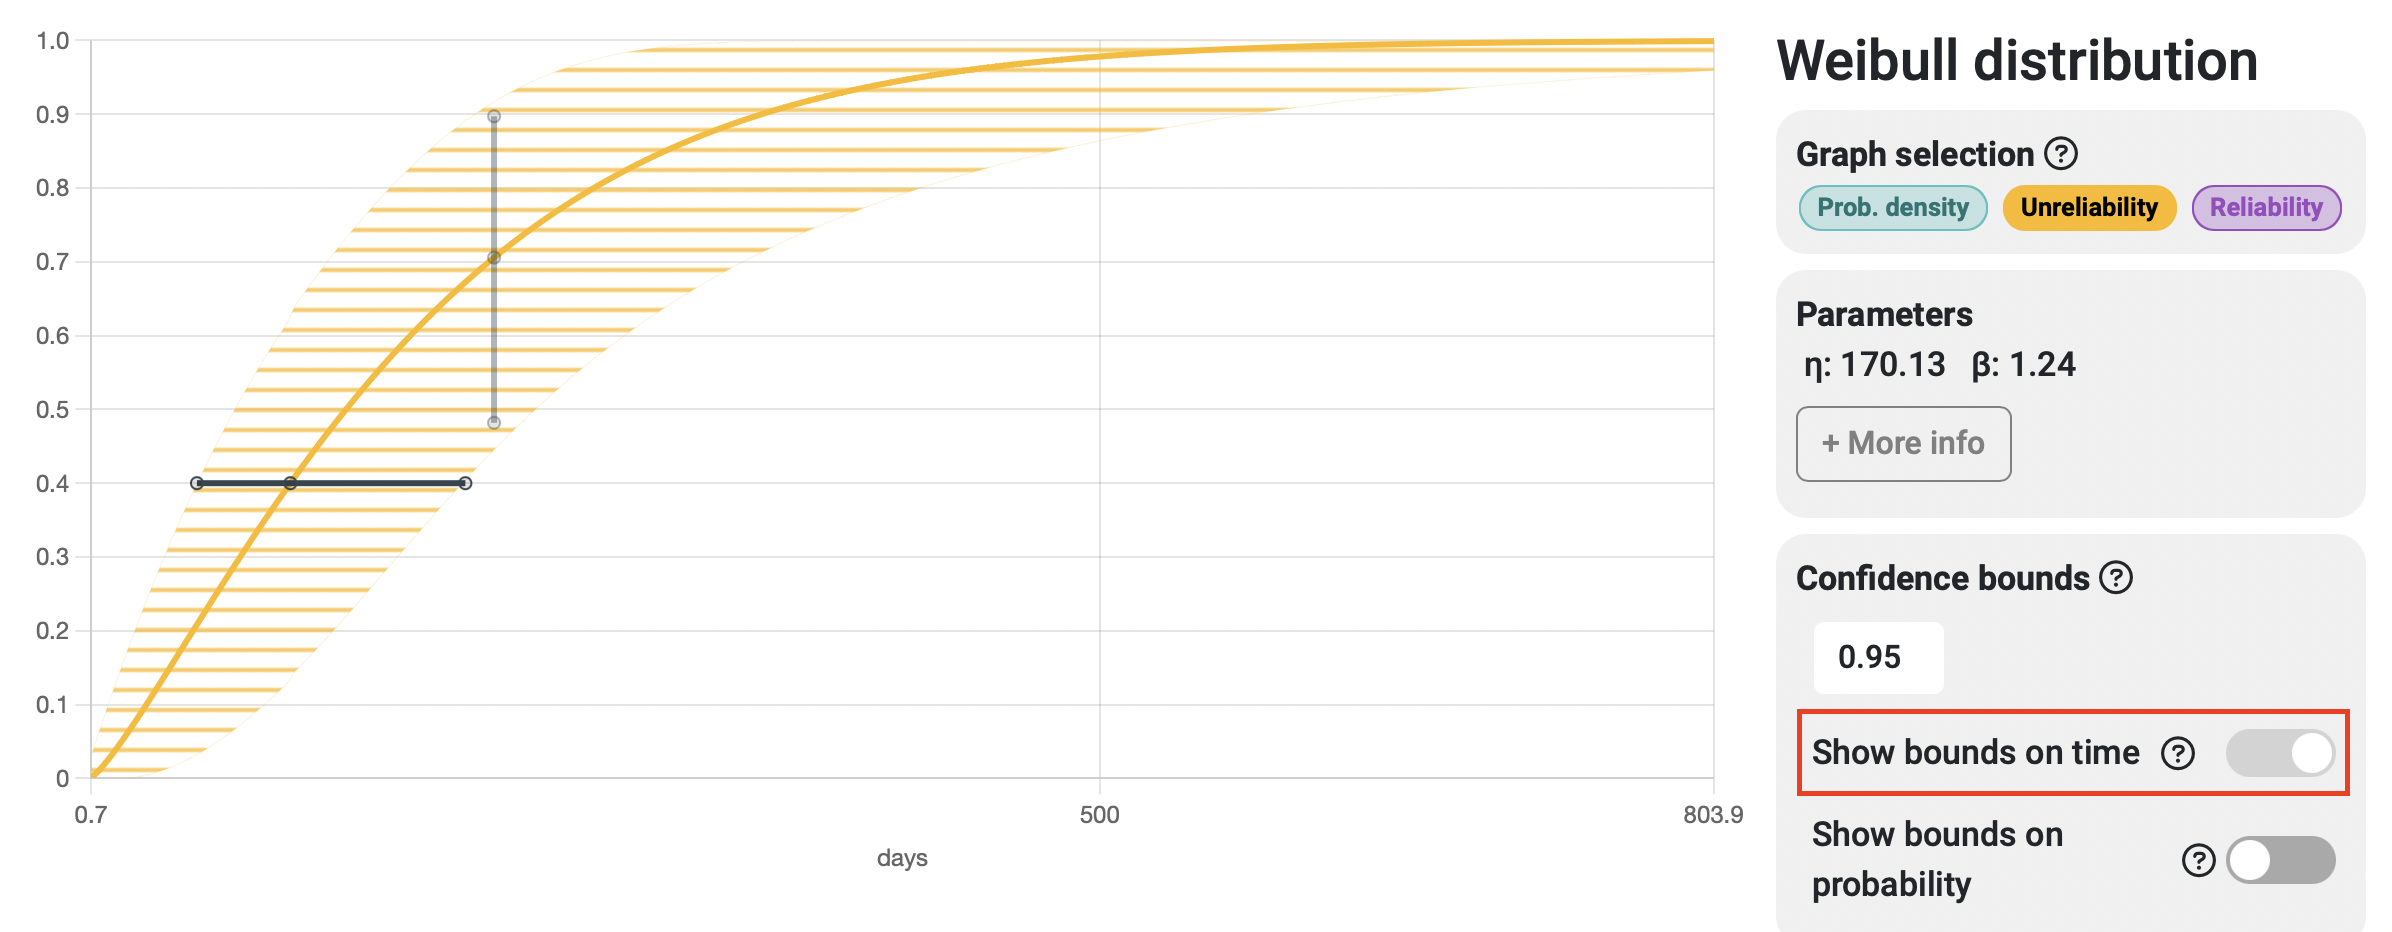
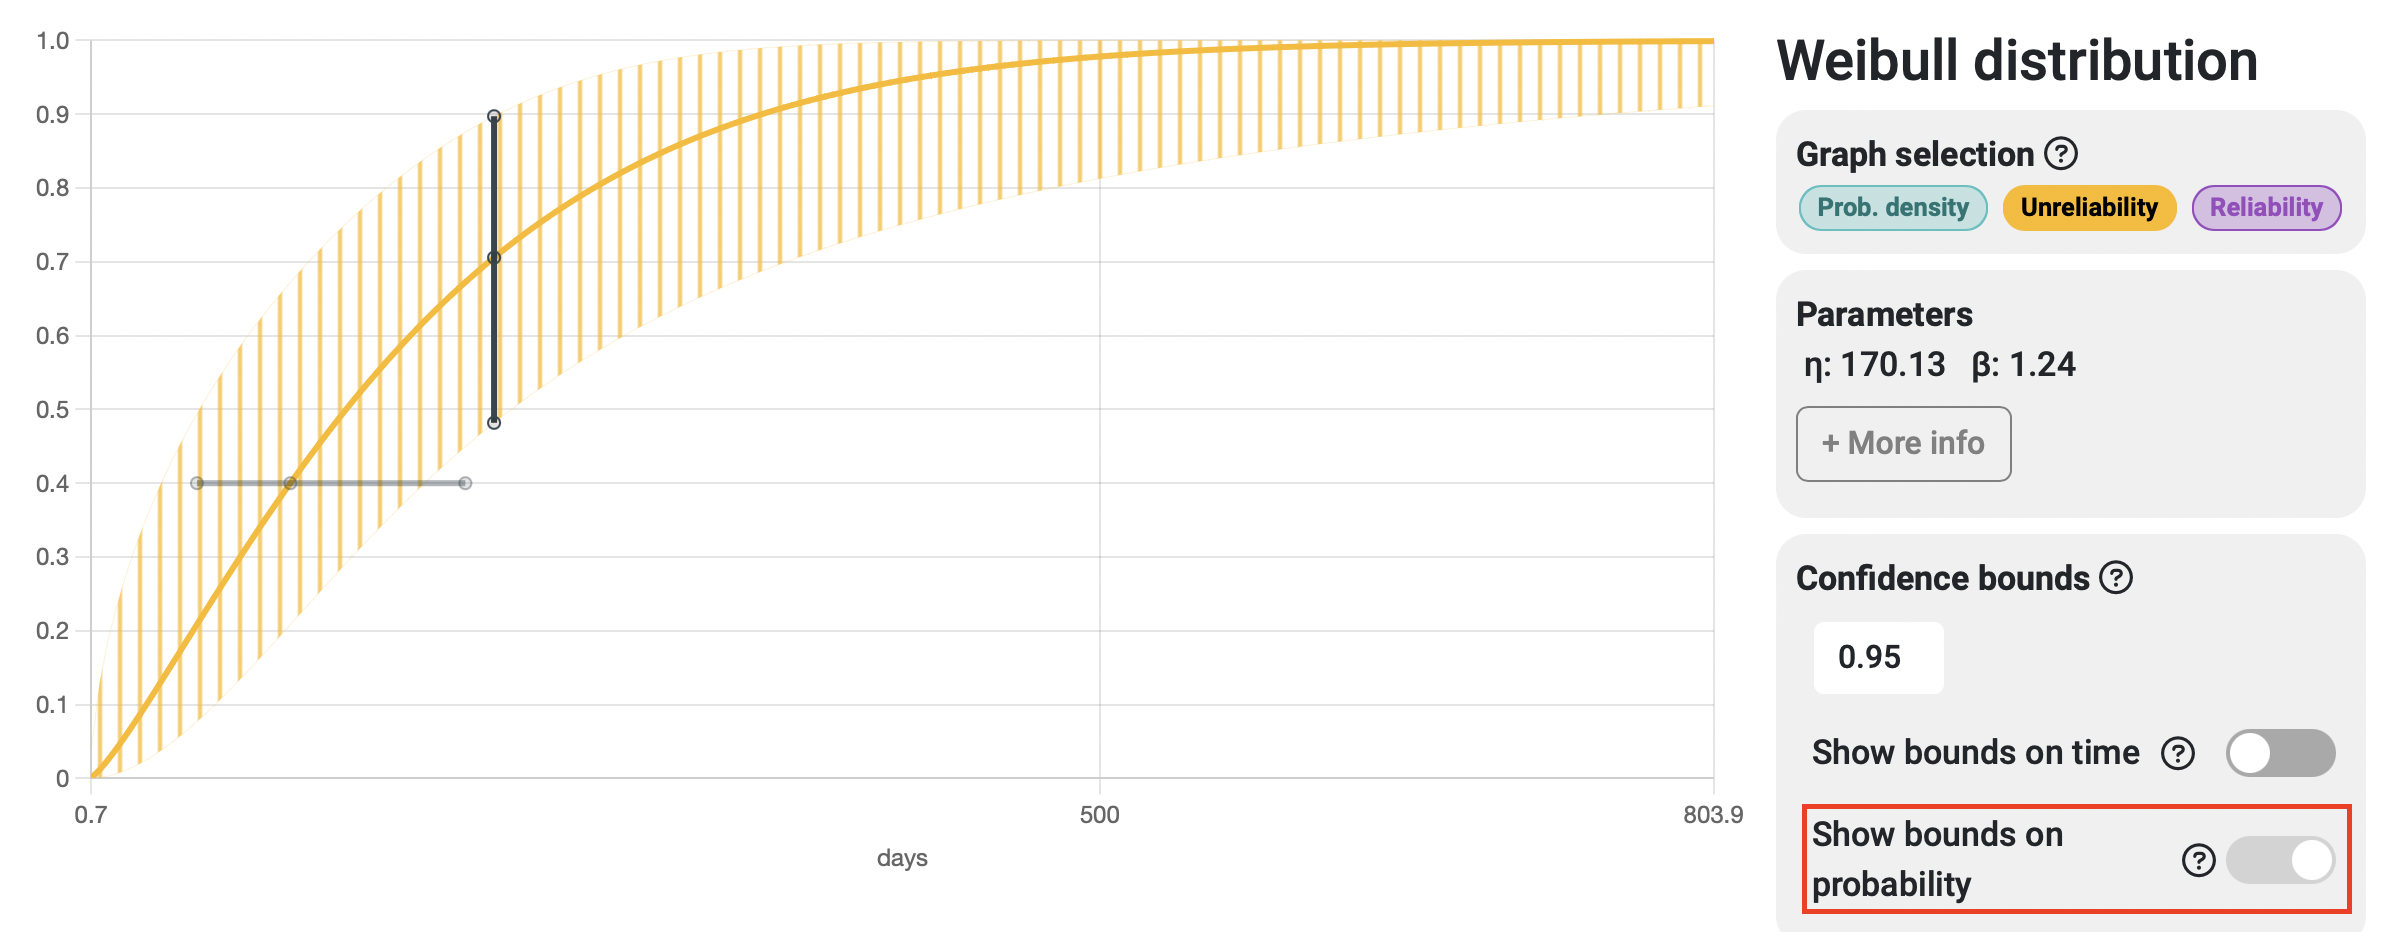
When interpreting reliability analysis results, we can answer questions related to time (e.g., at what time or number of cycles will 30% of the samples fail?) and questions related to probability (e.g., what is the probability that this system fails before performing 2000 cycles of operation?). Depending on the type of question we're asking, it makes sense that the variability of the response spans along the corresponding axis, with bounds on time spanning horizontally and bounds on probability spanning vertically. In many cases, both strips tend to match almost perfectly, but that is not always the case, and that's why Broadstat allows you to display both and automatically chooses the correct one based on the results you request to see.
