Thanks to Broadstat, calculating reliability parameters for your product is easier than ever. In almost no time, you can find yourself saying things like “With a 95% certainty, the 90% reliability for this product is reached at ____ cycles.” But, what does that even mean? And how are we supposed to know if those values are OK? Let’s dig a little deeper and explore what each of these things represents, as well as the most frequently used values throughout the industry.
Level of certainty or confidence interval
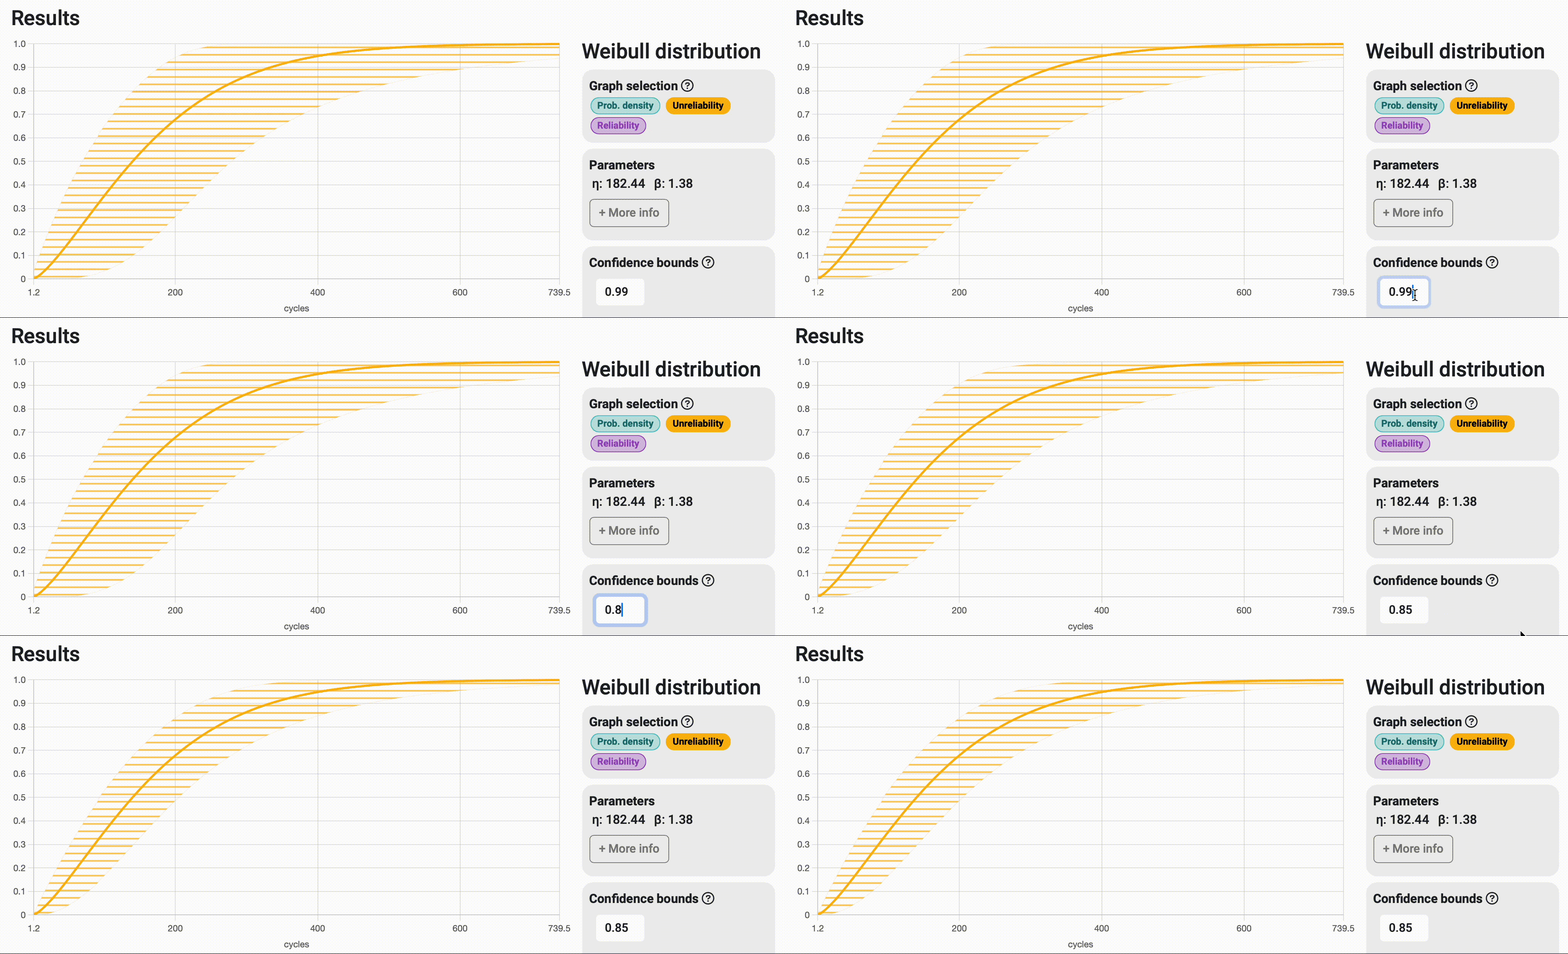
If you want a more in-depth explanation of what the confidence bounds are, I highly recommend reading our article about it. In summary, the confidence interval (also known as the level of certainty) is the range of possible values that could explain your data given a demanded level of assurance. If you want to be really sure about the results you are getting—let’s say 99% sure—the range within which the real value is will get wider to “ensure” (up to a 99% chance) it is indeed contained in it. A lower level of certainty will produce narrower result thresholds, given that the probability of containing the real results is smaller. The following image shows the effect of reducing the confidence bounds parameters in a Broadstat project.

As you may imagine, choosing a level of certainty that is too low makes little sense: selecting a 50% chance that your results are within the shown interval goes against the whole purpose of making a sound statistical analysis. Why not just choose a 100% level of certainty then? Well, some of the most extreme values that could explain your data are very unlikely to be the real answer to your analysis. If you chose to have 100% certainty, you would include those extreme values in your threshold, giving you very broad answers. For example, it would be of little use to know that it’s 100% sure that your system will fail between 50 and 50,000 cycles; it’s more useful as a response that it’s 95% sure it will fail between 22,000 and 26,000 cycles.
The most typical values used as confidence bounds are 99% and 95%. These are not only used within the engineering industry but across the entire scientific community as well. A good practice you could follow is to choose one of the two typical values and stick to it throughout all your projects. This way, when you compare different systems and their reliability parameters, you do it in a consistent way.
Reliability values
The reliability parameter of a system at a certain number of cycles (or whatever usage unit you use) represents the probability of such a system remaining functional at that given moment. For example, a 90% reliability at 30,000 cycles means that a certain unit of this system has a 90% chance of reaching 30,000 cycles and a 10% chance of not doing so. It also means that if you have a fleet of 10 units of this system, only 9 of them are expected to reach at least 30,000 cycles. On the other hand, if the parameter you are working with is unreliability, the meaning is the complete opposite: unreliability is the probability of failure, instead of the probability of remaining functional. For instance, a 90% reliability is equivalent to a 10% unreliability.
How you use these metrics in your company’s processes is completely up to you. There are no set rules or fixed values that must be pursued, but there are some recommendations that might guide you when setting quality objectives or design requirements. For example, if you are defining the requirements for the reliability of a subsystem you are about to develop, and your target value is 50,000 hours of usage, you may decide that at least 95% of the units you produce do reach that value. Or maybe 99%, or 90%. As with any other sort of design requirement, it depends entirely on the agreement made between all the parties involved, representing the interests of all the stakeholders.
So, as described above, some frequently used parameters when talking about reliability are 90%, 95%, and 99% reliability at a given level of usage. As a tip, when setting these requirements, make sure the chosen level of certainty (as discussed earlier in this article) is clearly stated. Also, be clear about which reliability/unreliability value is used as a result: the nominal value, which doesn’t take into account the confidence bounds; or the conservative value, represented by the lower end of the confidence interval. I guess it’s quite clear, but if you want to err towards the side of safety, it is better to use the latter. As an example, if the Broadstat results module of your project outputs the following answer:
“The system has a 95% probability of at least reaching 11,865.21 cycles of operation. This value, known as a reliability of 95%, is estimated to occur between 9,746.66 and 13,317.14 cycles when accounting for confidence variability.”
the value we may want to use is the conservative one: 9,746.66 cycles.
Conclusion
When it comes to confidence levels, the values you can choose are pretty much set by the standards defined by the industry. On the other hand, when it comes to setting requirements or evaluating the characteristics of an existing product, there is more freedom to select what makes more sense to you and your team. If you want an easy-to-remember combination, you may want to use a “double-ninety-five”: 95% reliability, with a 95% certainty.
